
Engineering intelligence platforms are having a moment. Gartner now estimates the market at roughly $400 million, growing more than 40% a year — driven largely by executive demand for evidence-based value delivery and the need to govern AI-enabled software delivery at scale — and has given the category a new name: Developer Productivity Insight Platforms (DPIPs).
The label is shifting, but the buying problem underneath it hasn't changed. Every platform in this category can hand you metrics and dashboards. Fewer help you act on what those metrics show, or tell you whether your foundation can handle what AI is about to do to it.
This guide separates the capabilities that are now table stakes from the criteria that actually predict whether an SEI platform drives change in a large engineering organization.
What are engineering intelligence platforms?
Engineering intelligence platforms pull data from your engineering tech stack — code, issue tracking, collaboration tools, and incident management — to show how developers work and whether that work aligns with business goals. They go beyond a spreadsheet tracking developer hours or a Jira dashboard showing team progress: an SEI platform gives leaders a unified, timely view of engineering effectiveness across the organization.
The table-stakes capabilities every platform should already have
The features below used to be differentiators. In a $400 million market now growing more than 40% a year, they're the price of entry. If an engineering intelligence platform is missing any of these, that's disqualifying — but having all of them doesn't tell you which platform will actually change how your organization works.
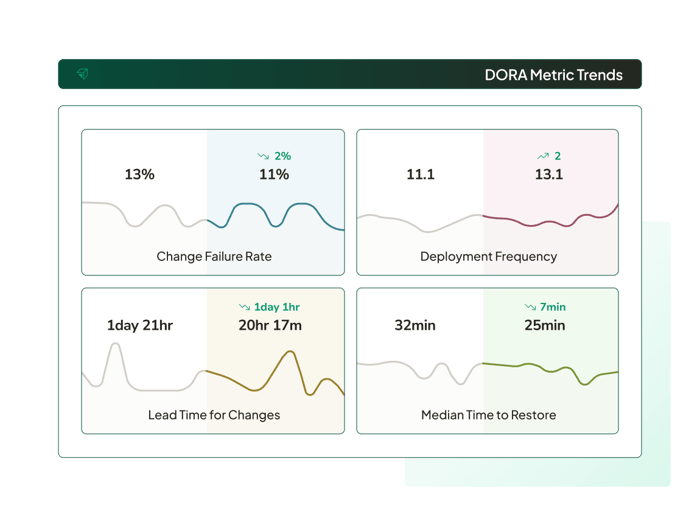
DORA metrics. Deployment frequency, lead time for changes, change failure rate, and MTTR are the baseline delivery metrics every platform should surface. They're lagging indicators — useful, but they tell you what already happened.
Advanced data handling. Engineering organizations develop their own ways of working as they grow, and Jira hygiene is never perfect at scale. A platform should classify work using contextual signals rather than requiring your teams to clean up their tickets first, and it should let you configure rules to match your own naming conventions instead of forcing a single taxonomy on every team.
Developer privacy safeguards. Metrics exist to find efficiency problems at the team and org level, not to score individual developers. A platform should surface deep work time, interruption load, and similar signals in aggregate — not expose which specific ticket or task consumed one person's day.
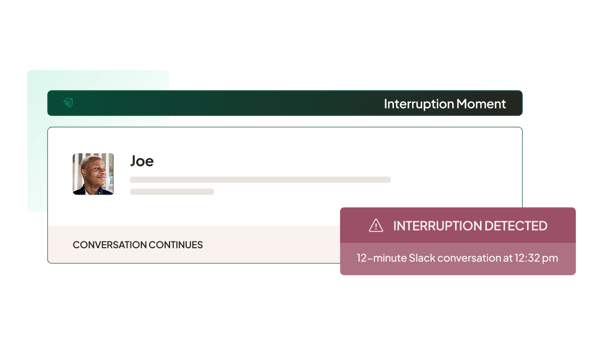
Collaboration tool integrations. Code commits and ticket updates only capture part of an engineer's day. A platform that skips Slack and Google Calendar signals misses most of the picture: meetings and chat interruptions breaking up the deep work that isn't happening around them.
On-premise connectors with configurable settings. Most platforms need access to source code, issue tracking, and collaboration tools, which is its own security exposure before you factor in your organization's compliance requirements. Look for a platform that only requires metadata — timestamps, character counts, lines added and deleted — with full on-prem control over how that data gets sanitized.
What to look for when choosing an engineering intelligence platform
Once the table-stakes list is satisfied, here's what to evaluate next.
1. Predicting problems with leading indicators
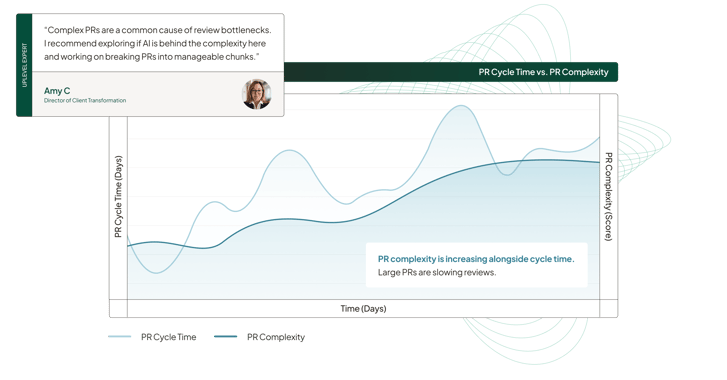
Understanding what happened yesterday isn't enough — engineering leaders need to catch problems before they hit delivery. That's why DORA metrics alone aren't enough: by the time deployment frequency drops, the underlying cause has usually been building for weeks. Leading indicators — PR complexity, deep work time, interruption load — surface the conditions that predict those changes while there's still time to act on them.
High PR complexity is often a canary in the coal mine. Oversized PRs tend to produce lower code quality, longer review cycles, and higher cognitive load — which shows up downstream as slower deployment frequency and higher burnout risk. A platform that only reports the lagging number tells you the damage is done. One that surfaces PR complexity and focus time tells you what you still have time to prevent.
2. Connecting engineering work to business outcomes
Most engineering intelligence platforms stop at engineering metrics. Cycle time, PR velocity, and deployment frequency are all useful, all fluent to an engineering leader, and largely meaningless to a CEO or board asking about revenue, cost, and whether the organization is building the right things fast enough. The data is accurate; it just answers the wrong question.
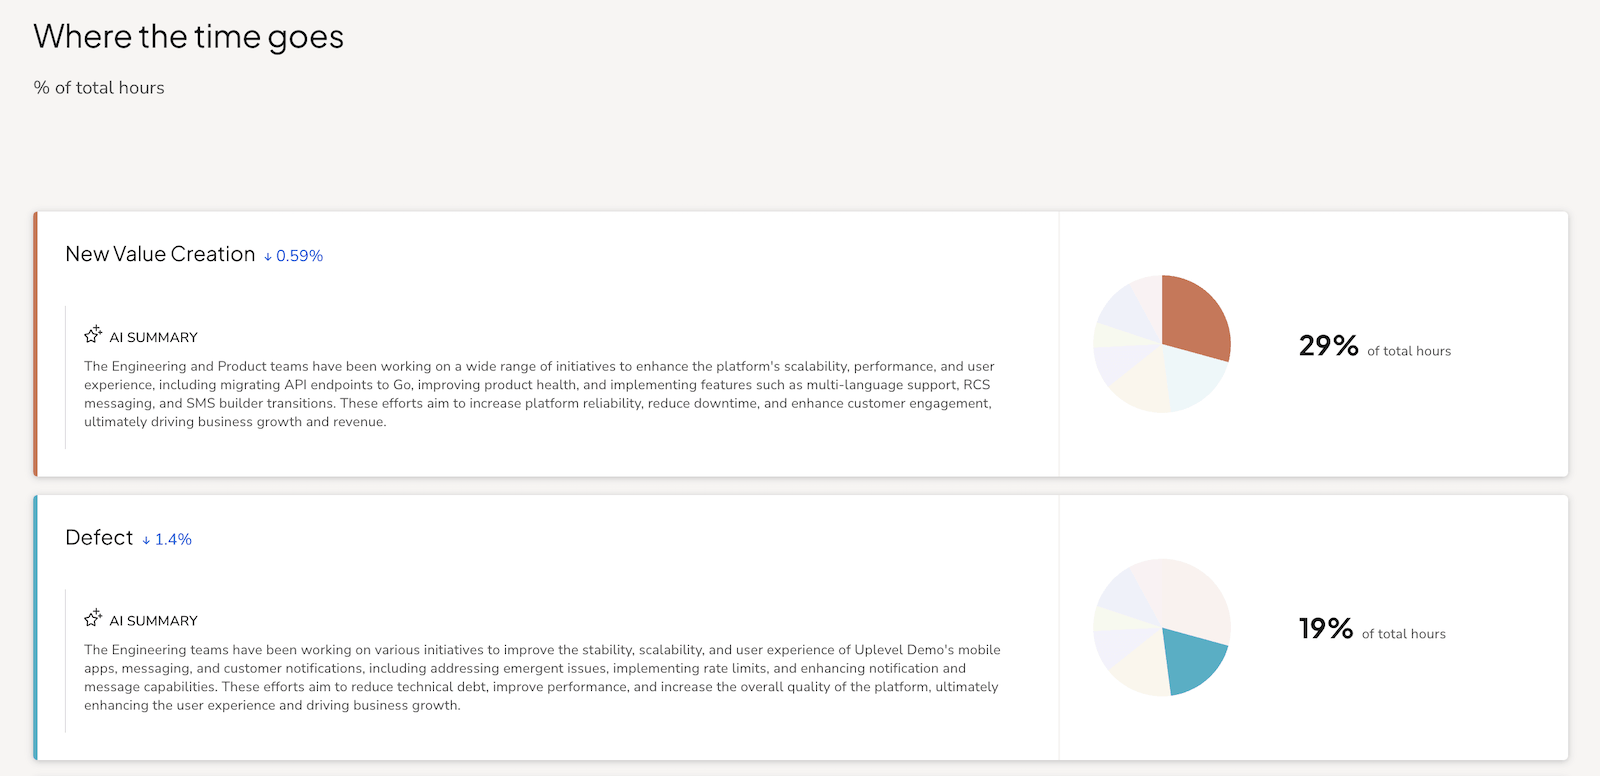
Look for a platform that connects delivery data to allocation: how much engineering capacity is going toward new value work versus maintenance and operational burden. Uplevel's own research puts average time spent on new value creation at under 20% across engineering organizations — a figure that turns a throughput conversation into a resource allocation question a CFO can act on. A platform that stops at delivery metrics leaves that translation to the engineering leader to do manually, in the room, under pressure.
3. Visibility across the full software development lifecycle
Most SEI platforms concentrate on the part of the SDLC that's easiest to instrument: commits, PRs, deployments. That leaves the earlier and later parts of the lifecycle — planning, requirements, QA, post-delivery feedback — as blind spots, even though bottlenecks originate there constantly.
Some of this data can be instrumented. Much of it can't be — a platform can't see why requirements keep changing mid-sprint or whether a handoff between dev and QA is a process problem or a people problem just from system data. That's where qualitative discovery matters as much as the platform itself: structured interviews and stakeholder workshops surface the root causes that quantitative signals only hint at.
An engineering intelligence platform that stops at the parts of the SDLC that are easy to measure is only showing you the delivery pipeline, not the system that produces it.
4. AI impact and AI maturity
Every SEI vendor now claims to measure AI. Few actually measure AI's impact on delivery, and fewer still connect that impact to organizational maturity.
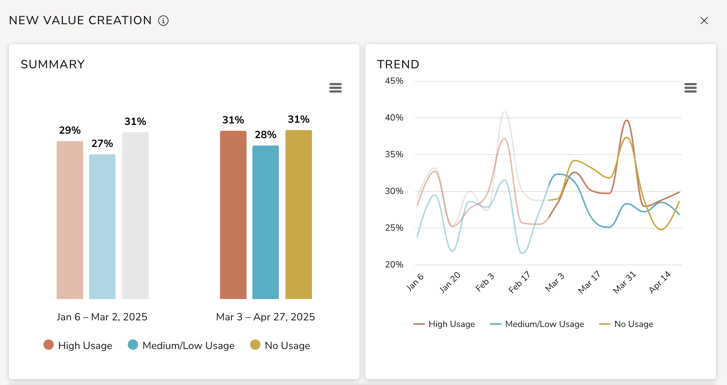
Token spend and seat counts are activity metrics — they tell you AI is being used, not whether the work it produces is better, faster, or cheaper. Look for a platform that separates volume from outcome: PR counts climbing doesn't mean cycle time is improving, and a platform that only reports the former can make a stalled team look productive. What's much more important to know is impact. How does AI usage impact time spend on new value work? Cycle time? MTTR?
A platform that reports AI adoption without connecting it to the underlying maturity of the engineering system can't tell you anything about ROI — and that's the question that actually matters for an AI investment conversation with the CFO.
5. A method for turning metrics into action
An engineering organization is a sociotechnical system, and optimizing the technology side is the easy part. People change is slower and messier, and it requires sponsorship and buy-in at multiple levels to stick. Most engineering intelligence platforms treat that as a "you" problem — you get the dashboard, and figuring out what to do with it is on you.
The platforms worth long-term investment pair measurement with a defined path from finding to action. Uplevel runs DevEx Discovery™️ (team surveys and structured developer interviews) against a quantitative analysis of your platform data, then sequences the findings into a prioritized roadmap and business case — so a criterion like leading indicators or AI maturity turns into a specific, sequenced fix instead of a number sitting in a dashboard.
What the checklist can't show you
Every criterion above can be scored from a vendor demo and a spec sheet. What a demo can't show is what happens six months after the contract is signed — whether the platform changes how the team works, or becomes one more login people stop checking.
That's the actual challenge in this market: platforms that surface data without a path to act on it. Uplevel combines continuous measurement with contextual understanding and capability building to drive sustained engineering transformation. DevEx Discovery™️ pairs platform data with structured interviews to find root causes a dashboard alone can't reach — the same qualitative work the full-SDLC criterion above depends on. From there, Uplevel's benchmark-first process turns the diagnosis into prioritized work, with an owner and a timeline attached to each change.
That's the part a checklist can't capture, and it's worth evaluating alongside the platform itself.

Know where you stand first — for free
Book a free 45-minute StackUp session with an Uplevel expert to see where your AI spend is going and how your org compares to other engineering orgs.
Frequently Asked Questions


.png)

![Top Engineering Intelligence Platforms [2026]](https://uplevelteam.com/hubfs/top-engineering-intelligence%20(1).png)