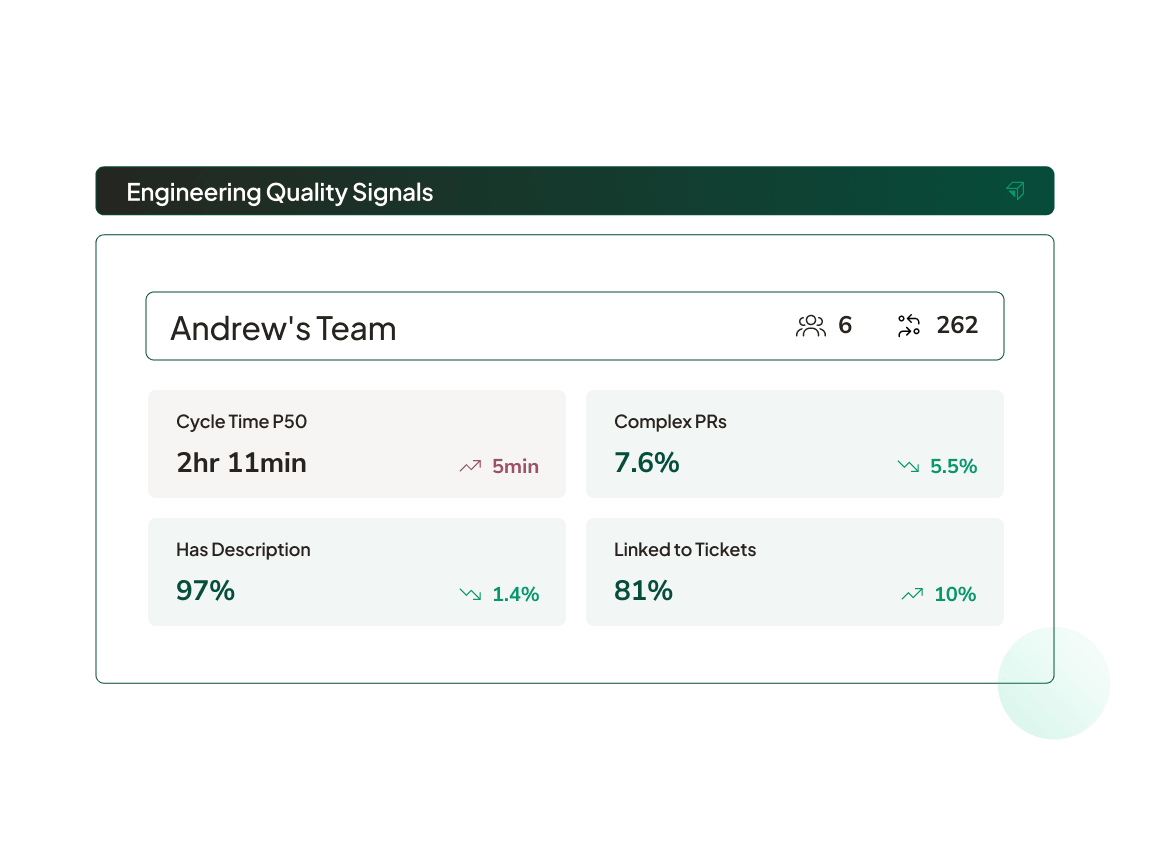
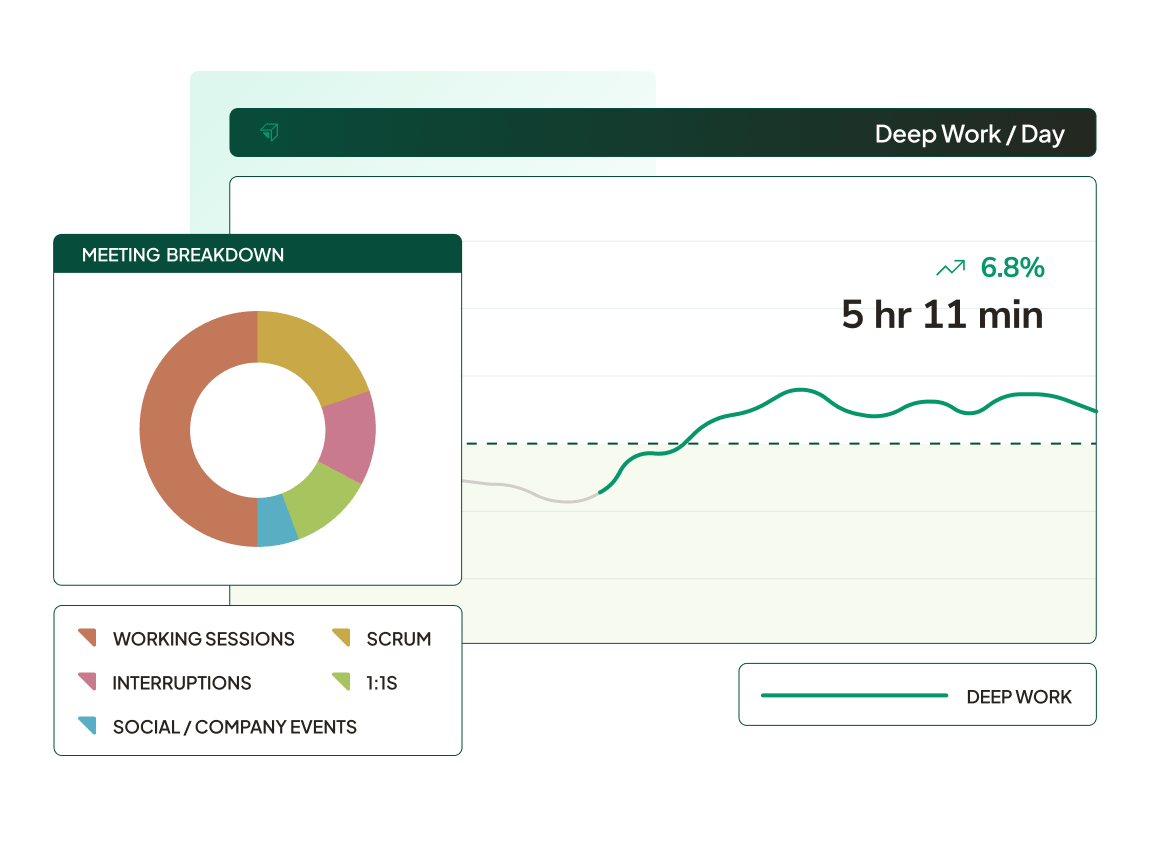
Team observability for transformation
Most dashboards treat data as the finish line, but it's really just the beginning. That changes what you need to see — more context and the messy reality like how teams actually spend time, where collaboration breaks down, and what creates friction.
Automatic work categorization
ML Issue Classification™ cuts through messy Jira to show where effort actually goes — new value, maintenance, defects, or tech debt — even when teams use different workflows.
Complete time allocation
Meeting classification and chat interruption tracking reveal where non-development time disappears. See how much time your teams have for actual focused work versus context switching and coordination overhead.
Leading indicators for delivery
Track PR complexity, review wait times, and handoff delays before they compound into increases in cycle time. Predict deployment bottlenecks and quality issues so you can intervene early.
Deep work patterns
Track sustained focus time across teams. Understand which teams have the capacity for complex problem-solving and which are drowning in fragmentation.
Crystal clarity across the full system
From delivery flow to team dynamics to AI adoption, Uplevel's capabilities reveal patterns that single metrics miss. Dive deeper:
Common questions about Uplevel data
What you'll see, how it works, and what it takes to get started.
What makes Uplevel different from other engineering analytics platforms?
Most engineering analytics tools stop at tracking metrics — DORA, cycle time, deployment frequency. Uplevel combines those measurements with sociotechnical context: how teams actually spend time, where collaboration breaks down, and what organizational patterns block delivery. We measure engineering team performance across the full system, not just code activity. Then we pair that visibility with expert guidance to help you identify bottlenecks and drive improvement.
Do we need to commit to full integration just to see if this helps?
No. Start with StackUp (10 minutes, no integration) for benchmarked insights. Move to GearUp (which works with sanitized data uploads) for deeper expert diagnosis. Full platform integration comes with annual engagement.
How quickly can we see meaningful insights?
StackUp gives immediate benchmarking. GearUp identifies your top 2-3 bottlenecks within 45 days. With full platform access, you see patterns as soon as integration completes — and with the work we've already done, you'll hit the ground running on building capability.
Can I look at specific teams, or just org-wide aggregates?
Both. View patterns across your entire organization, then drill down to specific teams, managers, or custom segments. Privacy protections keep individual developer data aggregated at the team level.
Can Uplevel help benchmark our engineering team against industry standards?
Yes. We provide industry benchmarks across key metrics like cycle time, deployment frequency, deep work availability, and AI adoption patterns. You can see where you're leading, lagging, or on track—and identify specific gaps worth addressing. Benchmarking works best when paired with understanding your unique context, which is why we combine it with expert partnership.
Is my data secure?
Uplevel adheres to industry-leading security standards to ensure your data remains protected.
- Encryption: All data is strictly encrypted both in transit and at rest.
- SOC 2 Type II Certified: Uplevel maintains SOC 2 Type II certification, verifying our rigorous controls over data security, availability, and confidentiality.
For a detailed view of our security posture or to download a copy of our latest audit report, please visit our Trust Center.
Our top resources on engineering metrics
How to Measure Developer Productivity for Real Results
Measuring developer productivity is hard within large engineering organizations. Here's why that is, and why a holistic approach is necessary.
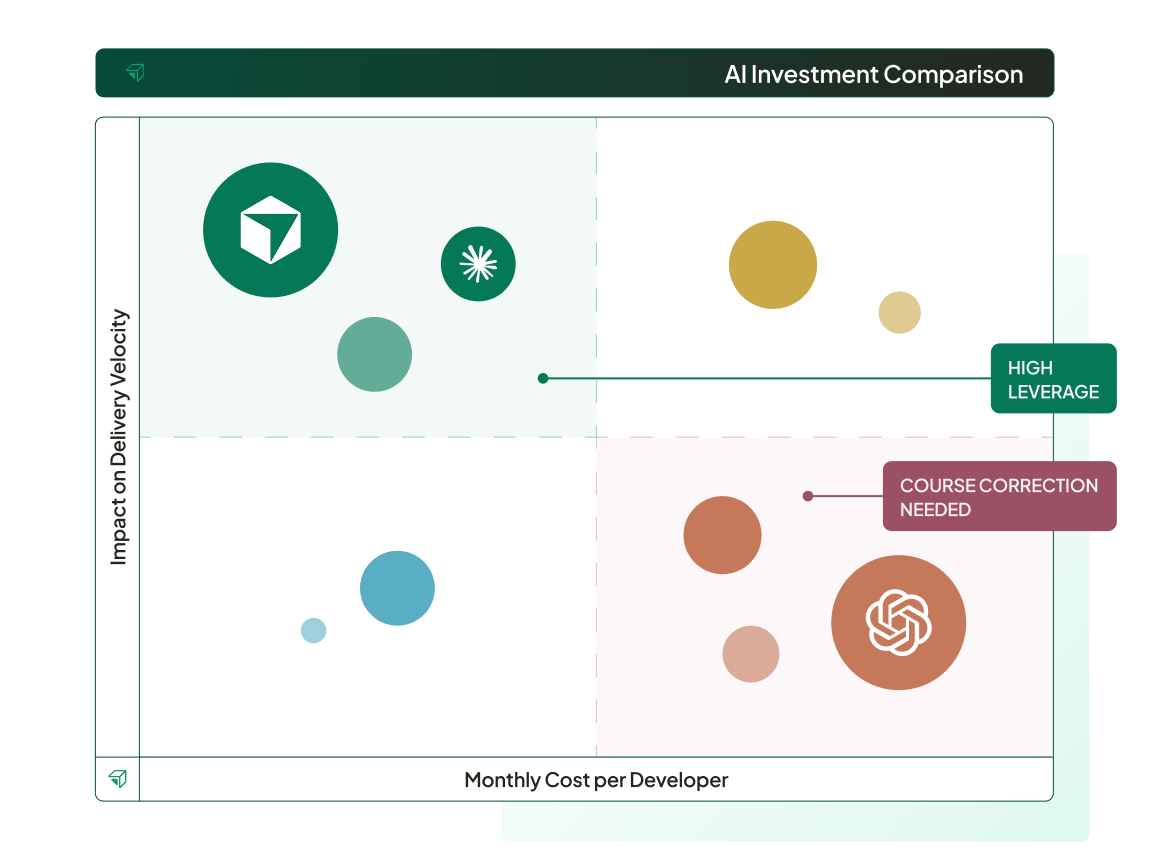
A Buyer's Guide to Engineering Intelligence Tools
How SEI platforms help large organizations drive meaningful improvement
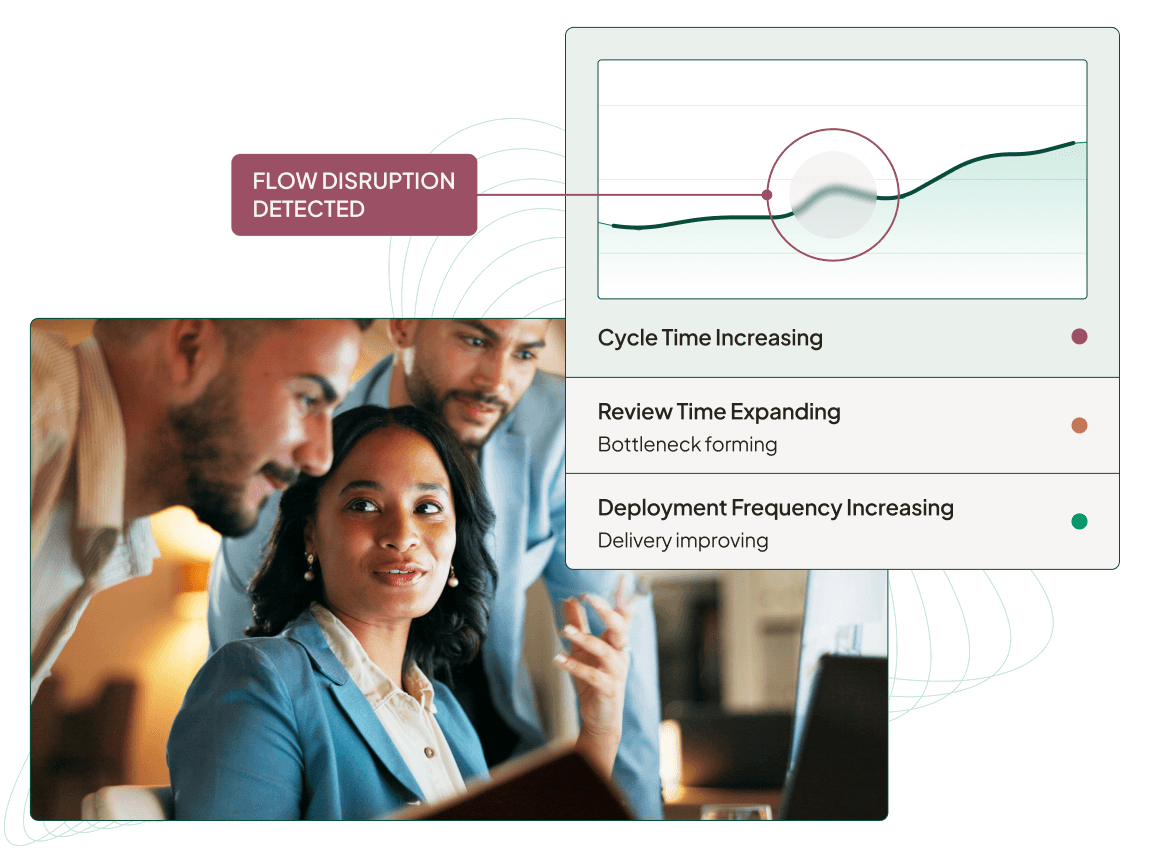
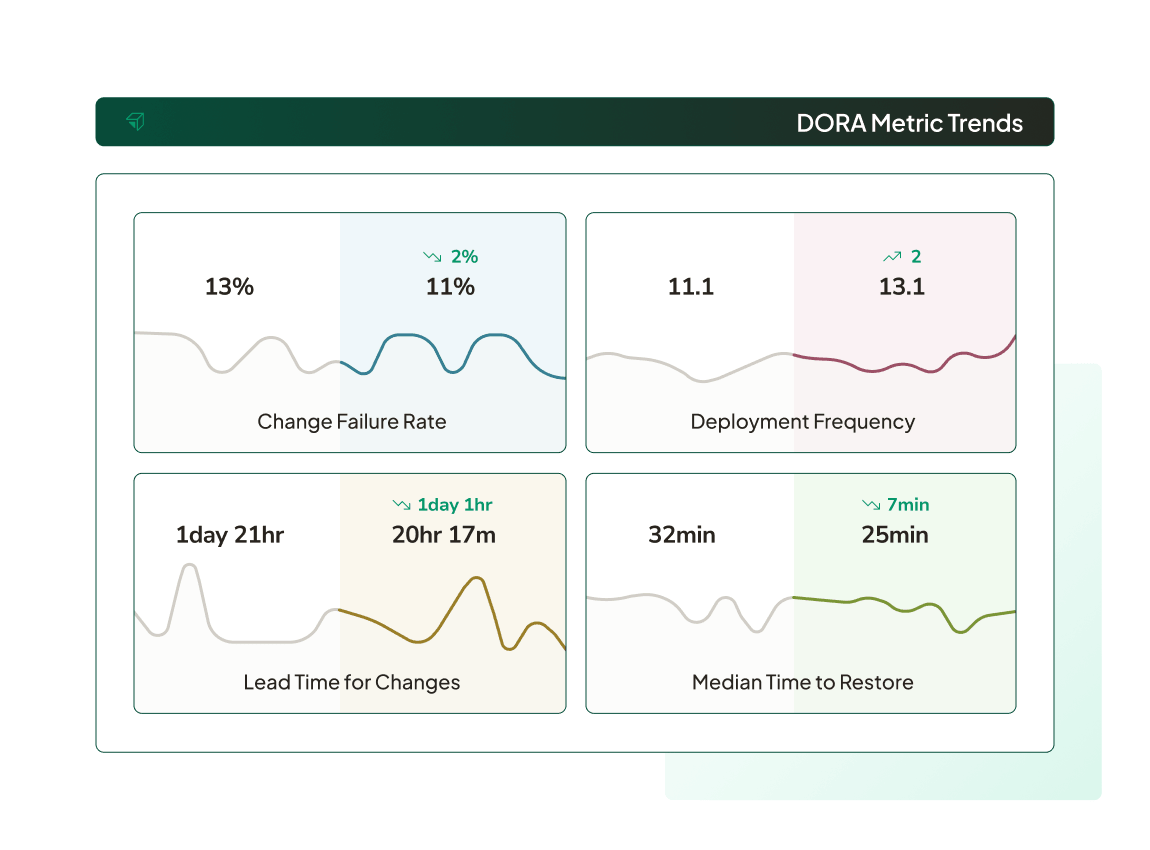
DORA Metrics Are a Start. Here's What Comes Next.
DORA metrics are lagging indicators of delivery performance because they don't explain context. Here's why engineering leaders need a better view.<...