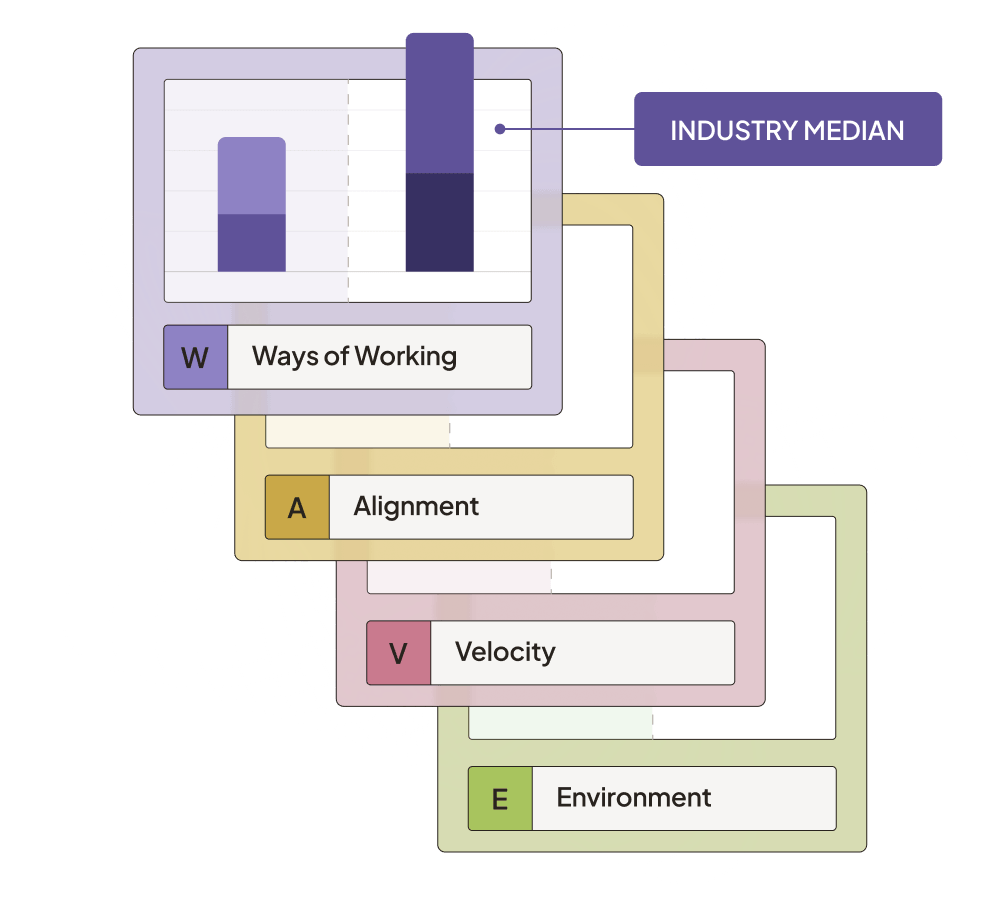
The WAVE Framework consists of four interconnected components:

-
Ways of Working: Measures cultural elements that enable delivery
-
Alignment: Captures how well engineering efforts connect to business value
-
Velocity: Tracks the flow of work through the system
-
Environment Efficiency: Evaluates system quality and friction
Each dimension of WAVE is summarized by a key engineering metric — a lagging indicator in that area. This metric is an outcome of the inputs that enable good engineering, which are leading indicators.
For example, improving engineering team health KPIs like psychological safety, meeting cadence, and mission alignment will naturally result in less overwhelm and more time developers spend in deep work.

Ways of Working
The Ways of Working Metrics capture the cultural factors and behavioral factors that enable delivery. Using Ways of Working, we recognize that engineering performance begins with people and team dynamics.
Deep work
Deep work metrics track the average number of daily uninterrupted hours developers can dedicate to focused coding time. Cal Newport's Deep Work shows the importance of uninterrupted focus for complex cognitive tasks like software development.
This concept is further supported by studies from the University of California. They found that after an interruption, it takes an average of 23 minutes for knowledge workers to return to their original task. For software engineers, context switching is particularly costly. Frequent interruptions lead to increased defect rates and longer completion times for complex programming tasks.

Team health
Team health metrics provide a consolidated view of engineering teams' psychological safety, collaboration effectiveness, and overall engagement. This approach is grounded in Google's Project Aristotle research, which identified psychological safety as the most important factor in team effectiveness.
In software engineering specifically, a 2024 study in Empirical Software Engineering found that teams with established psychological safety were more invested in software quality. The study showed these teams demonstrate "collective problem-solving, pooling their collective intellectual efforts and experience to tackle quality-related challenges."
When you track team health over time, you can identify early warning signs of burnout, disengagement, or collaboration challenges before they impact delivery.
AI maturity
AI maturity captures organizational capability for AI success: clear SOPs, coherent toolsets, compliance posture, and leadership direction. It's one of the most revealing dimensions in WAVE right now, because it surfaces a gap most organizations don't know they have.
Uplevel's AI Measurement Crisis survey of over 100 engineering leaders found that 88% describe themselves as "AI ready" — but only 2% have the measurement capabilities to back that claim up. The gap isn't typically tool access, it's clarity: what are we using AI for, which use cases show ROI, and how do we know?

Organizations with high AI maturity answer those questions systematically. They've established SOPs for tool usage, defined best practices by role and use case, ensured compliance and security, and aligned leadership on AI strategy. Developers spend time generating value, not deciding which tool to use or whether using it is sanctioned. Teams with lower maturity experience the inverse: organizational drag, inconsistent adoption, and AI activity that looks productive without connecting to delivery outcomes.
Improving AI perception leading indicators — guideline clarity, toolset coherence, leadership alignment — directly reduces this drag and creates the conditions for AI investment to compound rather than plateau.

AI only works if you can tell it's working.
More on Ways of Working


Alignment
Alignment is how leaders determine whether engineering capacity and effort translates into meaningful business outcomes. This dimension exposes the gap between what teams build and what drives actual value creation.
Allocation of effort
Resource allocation metrics track the actual distribution of engineering effort across new value creation, technical debt, and maintenance work. Unlike self-reported time allocations, data-driven measurements provide an objective view of where engineering time is actually spent.
In most organizations, developers believe they spend more time on new features than they actually do when their work is objectively analyzed. Our own research puts the average time spent on new value creation at just under 20%. That's one day out of five.

Planning effectiveness
Planning effectiveness reflects how well teams understand their work, capacity, and alignment with evolving priorities. It measures requirements churn, clarity of prioritization, connection to business value, epic lead time, and plan phase duration.
When teams consistently deliver what they commit to, it suggests a healthy balance between ambition and realism. Stable requirements indicate clarity in what needs to be built. This minimizes churn and rework that delay value delivery.
As always, however, context matters. These metrics should not be treated as success criteria on their own. A high sprint completion rate, for instance, could mask underlying issues if teams are playing it safe by undercommitting. It could also hide problems if they're delivering work that's no longer relevant due to shifting priorities.
Instead, planning effectiveness is a signal to detect misalignments in team capacity, requirement clarity, or cross-functional communication. When planning metrics fluctuate significantly, it may indicate that teams lack the information or autonomy needed to make reliable commitments. This can delay or derail the delivery of customer value.
More on alignment

Velocity
Velocity measures how efficiently work moves through your engineering system. True velocity assessment requires understanding both throughput rates and the friction points that create delays and coordination overhead in your development process.
Velocity score
Uplevel's velocity score combines PR cycle time, PR velocity, issue velocity, and deployment frequency (where available) into a comprehensive throughput measurement. This consolidated view reveals whether teams can consistently deliver completed work rather than just generate activity.
When evaluating velocity metrics, avoid comparing teams against each other. Teams operate under different contexts — varying codebases, workflows, review cultures, and priorities make cross-team comparisons misleading. Instead, compare each team's current performance against its own historical baseline to identify genuine improvement opportunities.
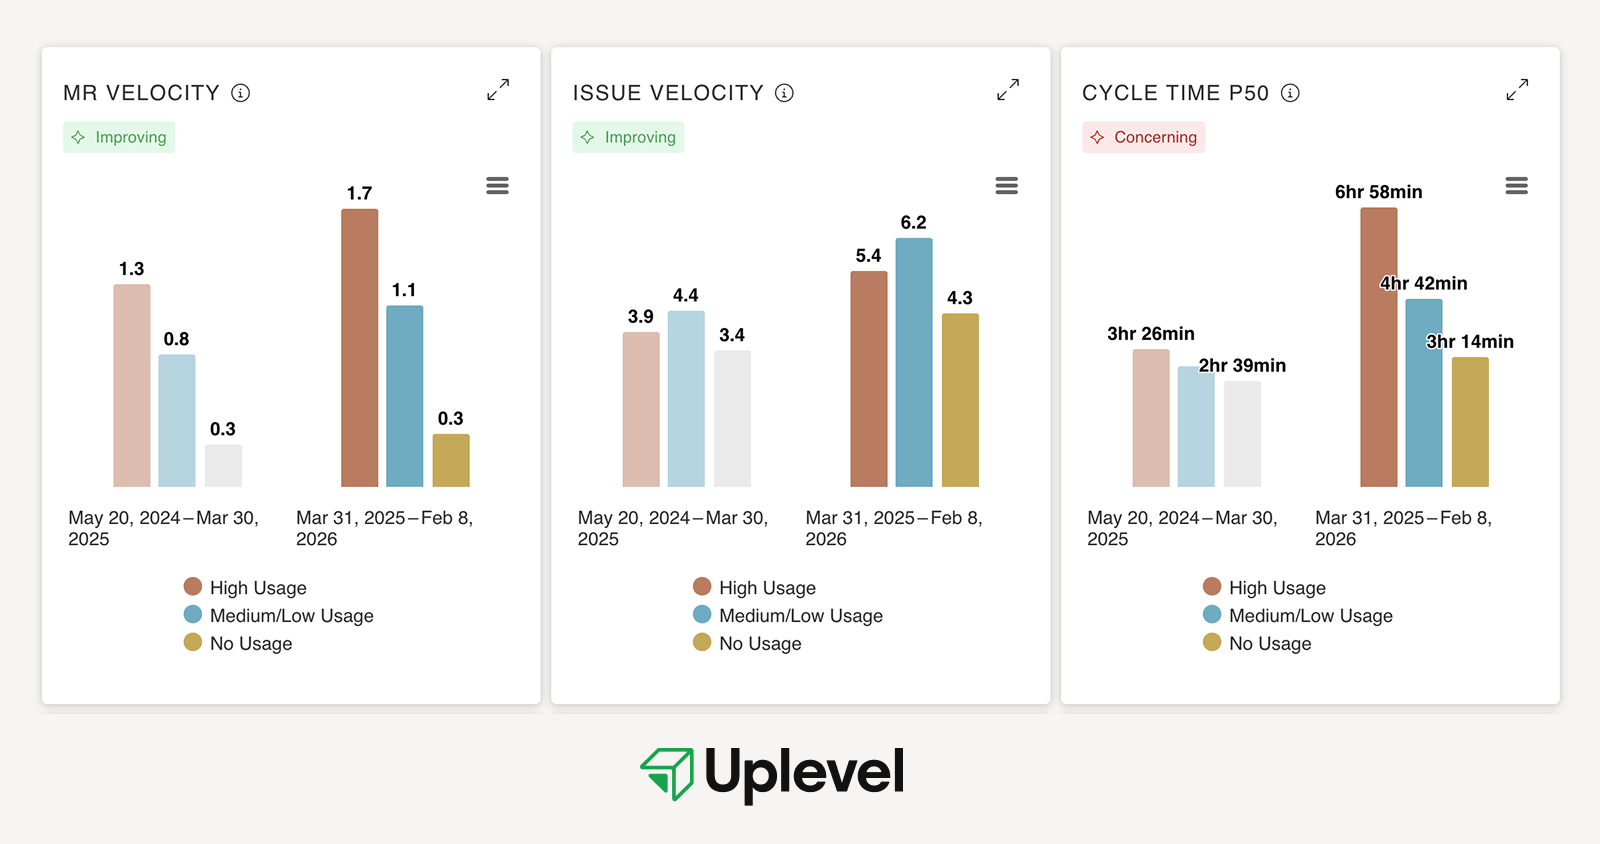
One additional complication worth tracking: in organizations with AI coding tools, PR complexity often increases significantly — in some cases doubling for high AI users — which extends review cycles even as raw coding speed improves. Velocity metrics interpreted without PR complexity data can misread this as a review problem when it's actually a batching and integration problem.

Handoffs
Handoff metrics evaluate both frequency and quality of work transitions between teams, individuals, or process stages. Each handoff introduces coordination overhead and potential communication gaps that slow delivery and increase error rates.
Research shows that minimizing handoffs through cross-functional teams can result in significant improvements. One McKinsey study documented a 45% decrease in code defects and 20% faster time to market after switching to cross-functional teams that reduced coordination dependencies.
Most organizations underestimate handoff costs because the delays appear as waiting time rather than active work. This makes them invisible in traditional productivity measurements.
Pull request reviews
Pull request review metrics examine PR complexity, PR quality, and review quality/time to assess both work structure and collaborative effectiveness. This measurement reveals whether teams create reviewable code changes and conduct meaningful peer evaluation.
PR complexity tracks oversized changes that create review bottlenecks. Large PRs are harder to review thoroughly. This increases defect rates and cycle times. PR quality measures whether changes include proper descriptions, link to tracking systems, and maintain reasonable cycle times.

Review quality evaluates whether the collaborative process catches meaningful problems. Effective reviews identify functional defects and architectural issues when remediation costs are lowest. They don't just catch style preferences that automated tools can address.
Teams with high PR quality and effective review processes ship faster with fewer production issues. Those with poor practices accumulate technical debt and spend more time fixing downstream problems.
More on velocity

.png)
Environment Efficiency
Environment efficiency measures how well your engineering system supports productive work and quality outcomes. These metrics help identify structural blockers to effectiveness that exist beyond individual teams.
Recovery
Recovery metrics combine lead time for changes, change failure rate, and mean time to repair (MTTR) — three of the four DORA metrics — to assess system resilience. These measurements reveal how quickly teams can deploy fixes and maintain stability under operational pressure.
Organizations with faster recovery capabilities demonstrate robust testing, monitoring, and deployment automation that enable rapid issue detection and resolution. The 2023 DORA report specifically highlighted that elite performers excel not just in deployment metrics. They also build cultures that support sustainable delivery.

Code quality
Code quality consolidates bug rates, customer-found defects, cyclomatic complexity, and support escalations into integrated quality assessment. This recognizes that quality issues compound. High complexity increases bugs, driving support escalations and customer-found defects.
Detecting defects earlier in the development process reduces the cost of remediation by orders of magnitude. Defects found in production can cost 100x more to fix than those found during code review. This makes upstream quality investments essential for sustainable delivery.

Friction and flow
Friction measures systemic obstacles through architecture complexity, tooling effectiveness, deployment processes, and flow optimization. These factors determine organizational drag that slows delivery regardless of team capabilities.
In knowledge work, including software development, items typically spend 70-85% of the time waiting rather than being actively worked on. This means a flow efficiency rate of just 15%. Most organizations have tolerated this because the waiting appeared as white space rather than visible inefficiency.
AI coding tools are changing that. When code generation accelerates but deployment frequency stays flat, the gap between activity and outcomes becomes harder to ignore. Organizations that assumed they had continuous delivery because they had the tooling are discovering that the practices, empowerment, and workflow changes required for real flow never happened. AI makes this visible. The question is whether leaders use that signal to fix the system or dismiss it as a pipeline problem.
More on Environment Efficiency
.png)