
The "DORA metrics," developed by Google's DevOps Research and Assessment team, emerged from a five-year study of 31,000 developers. This research, published in the 2019 State of DevOps report, introduced four key metrics for software delivery performance. A fifth was added in 2021. In the years since, DORA has continued to evolve — most recently, the 2025 report reoriented the entire framework around AI-assisted development. Through all of it, the DORA metrics have remained one of software development's most prominent frameworks. And through all of it, the same limitation has persisted.
The DORA metrics only tell half the story.
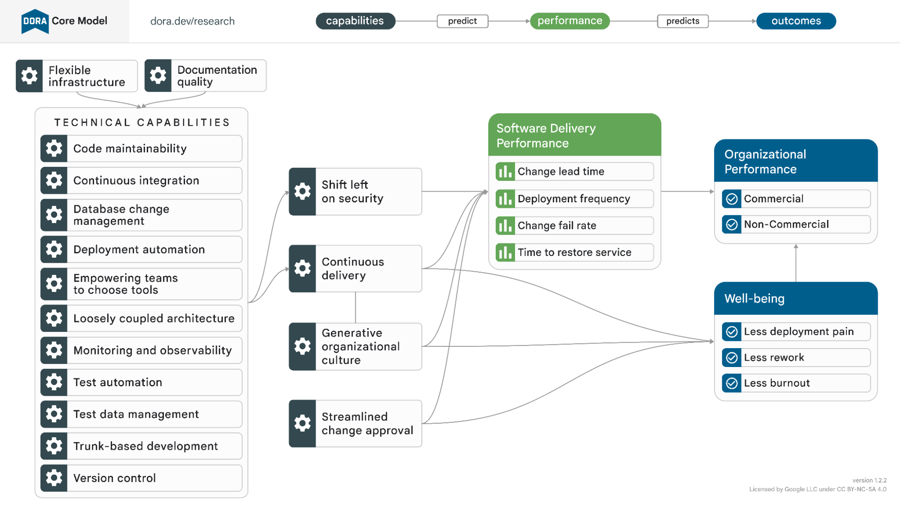
Today, forward-thinking companies, DevOps experts, and even DORA team members are pulling back on the reins. It’s not that the five metrics are wrong — it’s that they measure efficiency more than performance. But efficiency is only one part of the DORA Core Model that looks at engineering effectiveness in context.
DORA engineering metrics: What are they and what do they measure?
The DORA team outlines five DevOps metrics that fall into three main categories:
Throughput metrics
Throughput metrics indicate delivery speed, presenting a way to measure velocity outside of arbitrary measurements like story points.
- Lead time for changes indicates the amount of time between code commit and deployment to production. Are automated tests and a healthy CI/CD pipeline reducing the time a pull request sits in queue? Is there a healthy code review process for what must be done manually?
- Deployment frequency quantifies how often teams are successfully releasing code to production. Best practice recommends that the total number of deployments should be high. Deploying to production more frequently is a byproduct of streamlined processes and less complex PRs, which indicate healthy code reviews and more opportunity to catch errors.
Stability metrics
-
Change failure rate captures the percentage of deployments that require remediation. How much of the time was there a failure in production that needed a hotfix, patch, or rollback?
-
MTTR (mean time to repair) is the average time it takes to restore service when an incident occurs. The objective is to restore as soon as possible, ideally before users are affected. When software can be repaired quickly, that’s a sign of healthy architecture, incident response systems, and a well-coordinated software development team.
Reliability
- Reliability is often overlooked (you'll still see many references to the "four" DORA metrics), but was added later as its own category and metric. It measures operational performance: your team's ability to keep promises about the product they're building. This might be captured in artifacts like SLAs and error budgets.
Elite performers maximize speed and output when it comes to deploying functional code. But what if engineering teams are focusing on the wrong priorities or burning out to meet production demands? What if they're jeopardizing their ability to ship functional code in the future? Are they still high-performing teams?
What software efficiency metrics can’t tell you
At Uplevel, we look at DORA metrics — but we look at them as part of a larger picture. While they focus on team efficiency, they don't reflect effectiveness.
We define effectiveness as working on the right things in the right ways. This means aligning teams around the right priorities and giving them time to work on them. With increasing responsibility on engineering leaders to deliver business outcomes, the metrics themselves are a slice of a much broader conversation. It doesn't matter if you're moving faster if you're not moving in the right direction.
The 2025 DORA report makes this limitation harder to ignore. Its central finding is that AI doesn't fix a team — it amplifies what's already there. Strong teams use AI to get better. Struggling teams find that AI highlights and intensifies their existing problems.
That's a significant finding for how you think about measurement. If AI amplifies existing conditions, then the conditions themselves — how teams are structured, how time is allocated, whether engineers have space for focused work — are what determine outcomes. DORA's throughput and stability metrics will show you the results of those conditions. They won't show you the conditions themselves.
Let’s come back to the DORA Core Model, now simply represented like this:
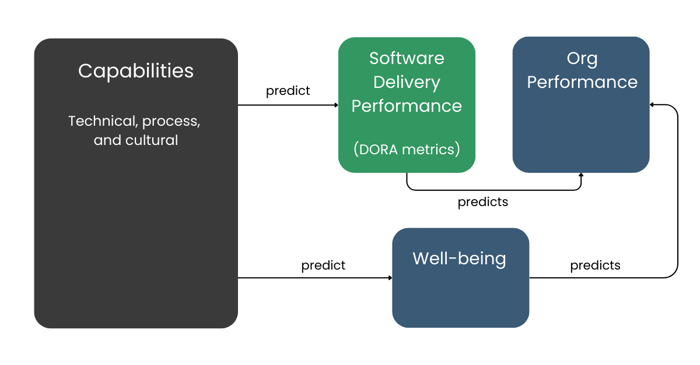
There are a few things to notice here (beyond the fact that the metrics are actually just a part of the whole picture):
-
DORA metrics are lagging indicators. They will give you a picture of delivery performance, but they won’t explain any of the context behind it. You'll need more context to know which capabilities are strong or lacking in your organization.
-
They don’t capture well-being, which is both an outcome of your capabilities and a predictor of organizational performance.
Why don’t classic software engineering metrics attempt to capture problems early? Given well-being's role in predicting organizational performance, why aren't team health metrics included?
Because people data is difficult to collect and interpret.
Outside of surveys, how can teams measure “well-being,” “burnout,” or “work recovery”? Available data is evolving, as is our ability to surface insights leading to high-value outcomes.
How to measure engineering effectiveness holistically
Measurement is the starting point, not the destination. DORA metrics might tell you what happened to your delivery pipeline, but they don't tell you why — or what conditions to change to get different results next quarter.
Most engineering orgs already have dashboards. They have data — they might even have DORA metrics they've instrumented themselves. What they lack is a framework that connects the leading indicators — the upstream conditions that predict DORA outcomes — to an actionable path for change.
That's what Uplevel's WAVE framework is designed to do.
WAVE treats engineering organizations as sociotechnical systems, where technical practices, team dynamics, organizational alignment, and environmental factors all interact to determine outcomes.

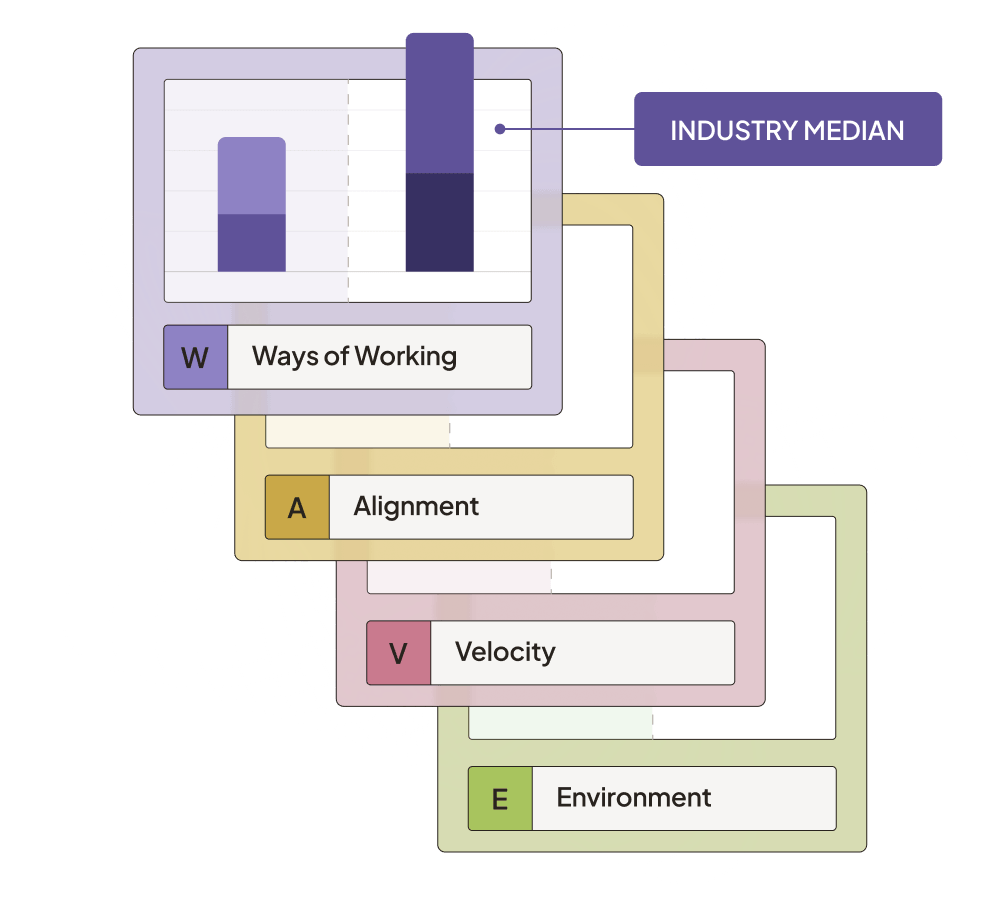
It organizes those factors into four dimensions:
Ways of Working captures the cultural conditions that enable delivery — team health, focus time, and how effectively teams are adopting AI. These are the factors DORA doesn't touch, and they're often the ones that explain why two teams with similar tooling produce very different results.
Alignment tracks whether engineering effort is actually going toward the right work — the balance between new value and maintenance, how stable priorities are, and how quickly teams get feedback from users after shipping.
Velocity measures how work moves through the system: throughput, handoff quality between teams, and PR review effectiveness. Slow handoffs and complex PRs are among the earliest signals of delivery problems — visible in WAVE well before they show up in DORA's change failure rate.
Environment Efficiency is where DORA metrics live, alongside code quality and process friction. Environmental factors determine whether engineering talent operates at full capacity or fights systemic constraints.
By the time DORA surfaces a drop in deployment frequency or a spike in change failure rate, something upstream already went wrong. WAVE is designed to surface those upstream signals first.
Measurement alone, though, doesn't change behavior. That's why Uplevel pairs the WAVE framework with expert partnership — combining platform data with qualitative assessment and hands-on coaching to help engineering leaders build the organizational muscle to turn insights into action.
Leaders don't need just another dashboard to check. Ultimately, they need their orgs to build the capability to continuously identify what's broken and fix it, without needing outside help to do it every time.
AI requires the full story
DORA metrics were built for a different moment. Engineering leaders today face a harder question: if their organizations can actually adapt to AI, or whether they're accelerating toward the same problems they've always had. The 2025 DORA report's central finding is that AI amplifies what's already there.
Strong foundations get stronger. Weak ones get exposed faster, and at greater cost.That makes the conditions DORA doesn't measure — how teams are collaborating, whether effort is aligned to the right priorities, whether engineers have the focus to do their best work — more consequential than ever.
Most engineering leaders already have dashboards showing them something is wrong. DORA is a start. The rest of the work is understanding your organization as a system so you know what to fix, and how.

.png)