For enterprise engineering organizations, thoughtful and prioritized time allocation is essential to delivering high-quality software on schedule. But the manual and labor-intensive methods often used to allocate developers' work, like surveys and time tracking, are problematic. They're unsustainable, prone to inaccuracy, and obsolete by the time the data is ready for review.
Uplevel solves that pain by ingesting data from your organization’s dev tools to surface a data-driven (read: faster and more accurate) estimation of actual developer time.
One of the concerns potential customers raise is whether or not an engineering intelligence platform is capable of handling their unique data. It’s a fair question. Many solutions do require clean data to provide usable allocation metrics, which means they are not the right choice for organizations who want to avoid a costly and time-consuming migration process to standardize workflows.
At Uplevel, we’ve developed a better alternative: an intelligent allocation model that can interpret product data as it is and use other signals across sources to enrich your organization’s allocation story.
Identifying available working time
Meetings
To understand the picture of a developer’s day, the first data source Uplevel looks at is calendar events. A typical day might consist of:
-
a daily 30-minute standup
-
a 30-minute 1:1 with your engineering manager
-
45 minutes for lunch
-
an hour-long pair programming session with a senior dev
-
a 45-minute optional training event that you initially accepted, but then canceled at the last minute because you’re in the middle of a good flow and didn’t want to stop.

In this example, those various events add up to 2 hours 45 minutes, but 1 hour doesn’t really count because it was a pair programming session.
Uplevel is able to accurately account for this entire day thanks to its machine learning model, the Meeting Classifier. While Uplevel’s model may not get the classification correct 100% of the time, this insight is directionally helpful for both leaders and managers to see where devs may be losing their time.
Next, our Meeting Reconciliation algorithm takes into account the attendees of the meeting based on each individual's response to figure out which meeting they attended (or not). This algorithm is critical to pick up the last minute meeting adds/drops and cancellations to get an accurate picture of a developer’s day.
Chat Interruptions
While meetings affect available development time the most, it’s also critical to look at how chat interruptions play a role.
Imagine a junior developer runs into an error while trying to get their code to run and they're stuck. Not wanting to waste time, they send a DM to the senior developer, which results in 20 minutes of back-and-forth. For the junior developer, this was a necessary step to get them unblocked, so the 20 minutes was part of their workflow to get unblocked. But from the perspective of the senior developer, this pulled them away from what they were working on, causing a context switch.
Uplevel accounts for this with our Conversation Segmentation Analyzer. This model looks at the metadata of messages in Slack, the channels, and threads that they are in. It is also able to account for multiple conversations that may be happening within a given channel, and sort out what messages are likely tied together.
In our example above, the model would account for 20 minutes of interruptions for the senior developer, but 0 minutes of interruptions for the junior dev, because they were the originator of the interaction.
Out-of-Hours Work
While many developers work a pretty standard 9am-6pm, this is also just as likely to be an 11am-8pm, or a 9am-3pm / school pickup & rock climbing / 8pm-10 schedule. Sometimes inspiration (or a forgotten deadline) strikes, and 10pm to midnight might be what it takes to get the work done.
Uplevel accounts for ever-shifting and split schedules with its Always On model. Always On takes a holistic view of the activity observed in a developer’s day (meetings, interruptions, project tracking tickets, and pull requests) to find the hours of the day with the most activity. It then looks for work that spills over into other hours. This can manifest in our example above, where a senior developer has 5 hours of meetings and 45 minutes in a day, then they work on a PR for a feature they’re building, update a ticket, grab some dinner, and then catch back up on some PR reviews.
By analyzing calendar, chat, and Always On data, Uplevel is able to give engineering leaders insight into how much time developers really have for work. This isn’t to say that meetings are unimportant or that there’s too much chatting happening — but it can help account for a person taking three days to do a half-day task when they’re otherwise pulled away.
The next step is to determine how developers are spending the rest of the time — the time they do have available.
How our time allocation model works
Uplevel has a novel approach to how we calculate allocation. Where many companies claim they can provide allocation metrics without calendar integration, we find that calendar data is critical to estimate work activity with enough precision for enterprise organizations, especially when Jira is not able to tell the whole story.
Why? Because time allocation needs to be based on actual work time available, which varies widely across engineers, their teams, and entire company cultures. Here’s how it works:
1. Visualize all work
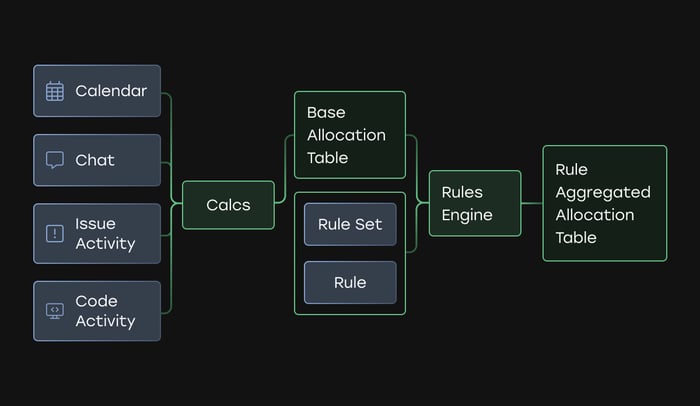
The first step is collecting daily availability and activity data from connected sources. This gives an automated and integrated look into the work done and the time available to do it.
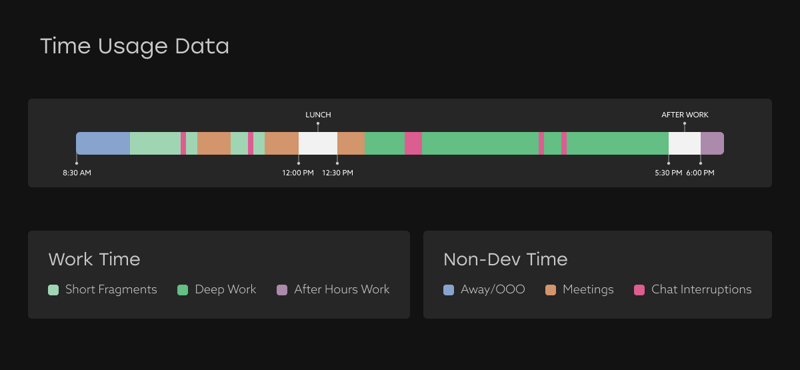
Time usage data is pulled from calendar data and illustrates how much time is available for work. If an engineer is out of office, attending meetings, or involved in lengthy Slack conversations, we assume that they are not available to perform development tasks. Work time, then, is what remains (after a lunch break that we also build in).
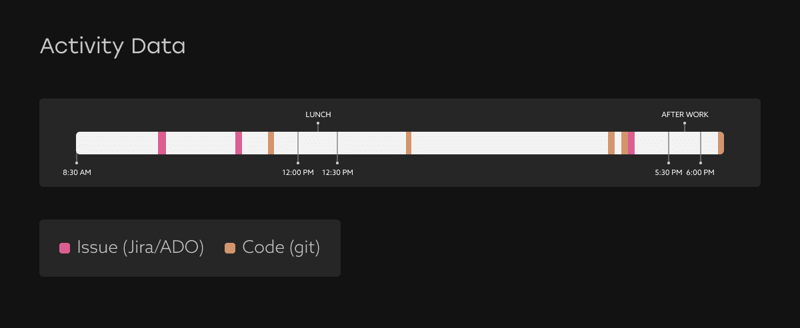
Activity data is the collection of signals from PM and code platforms that indicate a) that the engineer is actively working and b) what issue or code they’re working on. This type of activity might include:
-
changing ticket status
-
adding descriptions or attachments
-
committing, commenting on, reviewing, or merging code
This activity provides important timestamps that form the basis of our allocation — even if the project data itself is incomplete or messy.
2. Match available working time to activity
Now it’s time to apply the activity data to the available working time. We do this by looking at the distribution of activity (the space between timestamps) as a portion of the entire working day. Then we apply that same percentage of available working time as the allocation.
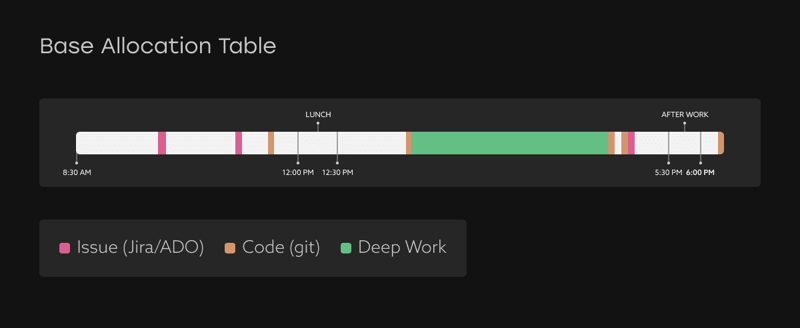
For example, imagine the green bar of work time above is 35% of the distribution. We’ve calculated that this person had 5.75 hours of available work time this day, so this stretch of time should get 35% of that 5.75 hours, or 2 hours, which is then allocated to the activity at the end of that block.
Once the estimated time for each type of activity is calculated for each person and each day, we now have the basic data. Now we need to further enrich and categorize this data so that it can be viewed in higher groupings of work.
3. Apply rules engine "magic" to clean up and enrich data
At Uplevel, our customers come to us with wide variability in how they track time and label work. Not only does every company have its own project naming conventions, but it’s not uncommon at the enterprise level for each team to have its own conventions as well.
Uplevel’s rules engine provides configurable data handling to account for different conventions in Jira and Azure DevOps projects. Each customer has its own set of rule definitions. Some are pre-seeded, such as Project, Epic, and Initiative, while others are custom fields and customer-defined aggregations.
For example, if leaders want to categorize new feature work and differentiate it from KTLO, Uplevel can configure the rules engine so that issue titles like “refactoring” or “maintenance” fall into the KTLO bucket, but issues that include “feature,” “enhancement,” “new,” or “customer request” would be categorized as new value.
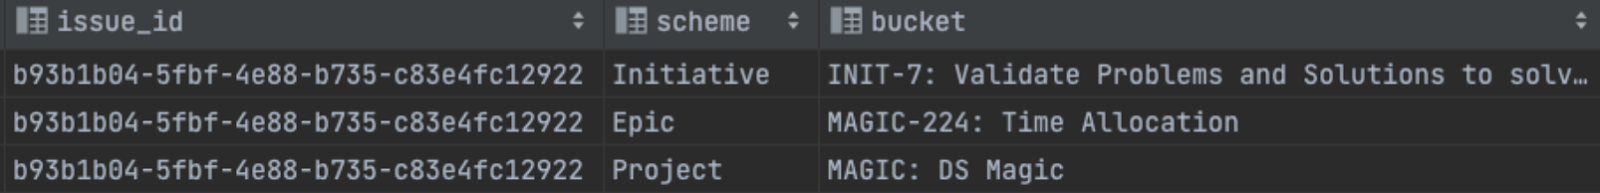
Running the data through the rules engine applies an allocation “bucket” to each block of work and its associated PR or ticket. From there, Uplevel can calculate and display aggregate results on the front end based on work time, activity, and allocation category.
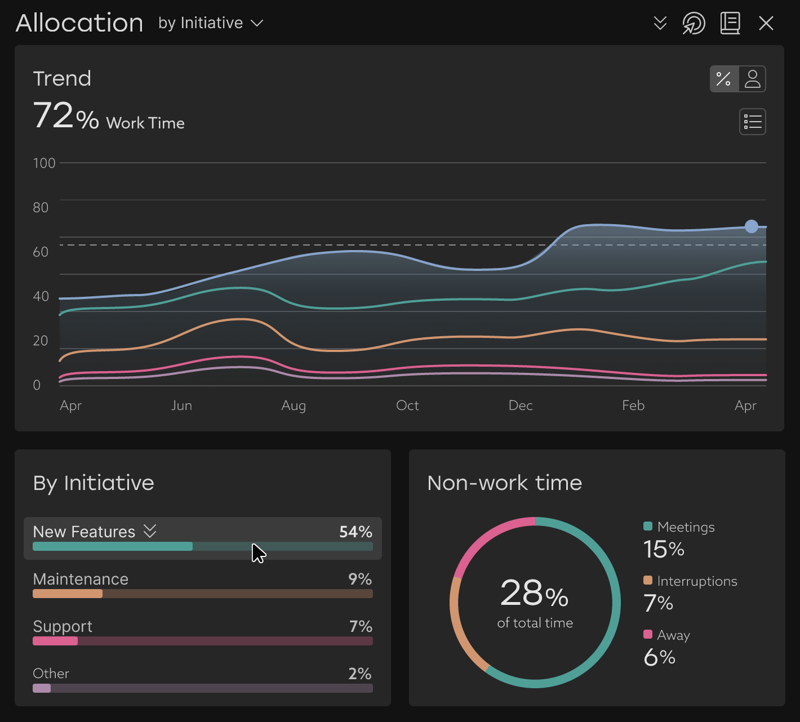
For example, as an engineering leader, you might first want to understand investment in new value, KTLO, bug fixes, support, research, etc. This helps you understand the types of investments you’re making… but that’s not enough. Maybe you also need to understand how much work is going into your top priorities. If you have five top-level initiatives that you expect the team to be spending time on, how much time are they actually investing in those projects? Is there lingering work from last quarter's initiatives that are continuing? Are you actually solving your most important problems?
We often find that every leader has different organizational context that they will want to apply to understanding time spent. One of the advantages of Uplevel’s time allocation model and rules engine is that it can allow them to set up their views to show that context.
Engineering time allocation for empowered decision-making
Accounting for the variability in issues, workflows, and priorities allows Uplevel to surface actionable insights from allocation data to solve common pain points:
-
Capacity Planning: Rolling up individual work items into higher-level categories like feature development, maintenance, and failure demand work allows for holistic views of team activities. Engineering leaders can get a better sense of how much time engineers are spending on projects and make data-driven arguments for how to prioritize new product and feature requests based on capacity.
-
Organizational Reporting: Where sales and marketing can clearly report on data like conversions and revenue targets, engineering leaders often do not have easily attainable metrics to present to executives and stakeholders. Uplevel allocation data is easily presentable to explain at a high level “what engineering is doing.”
-
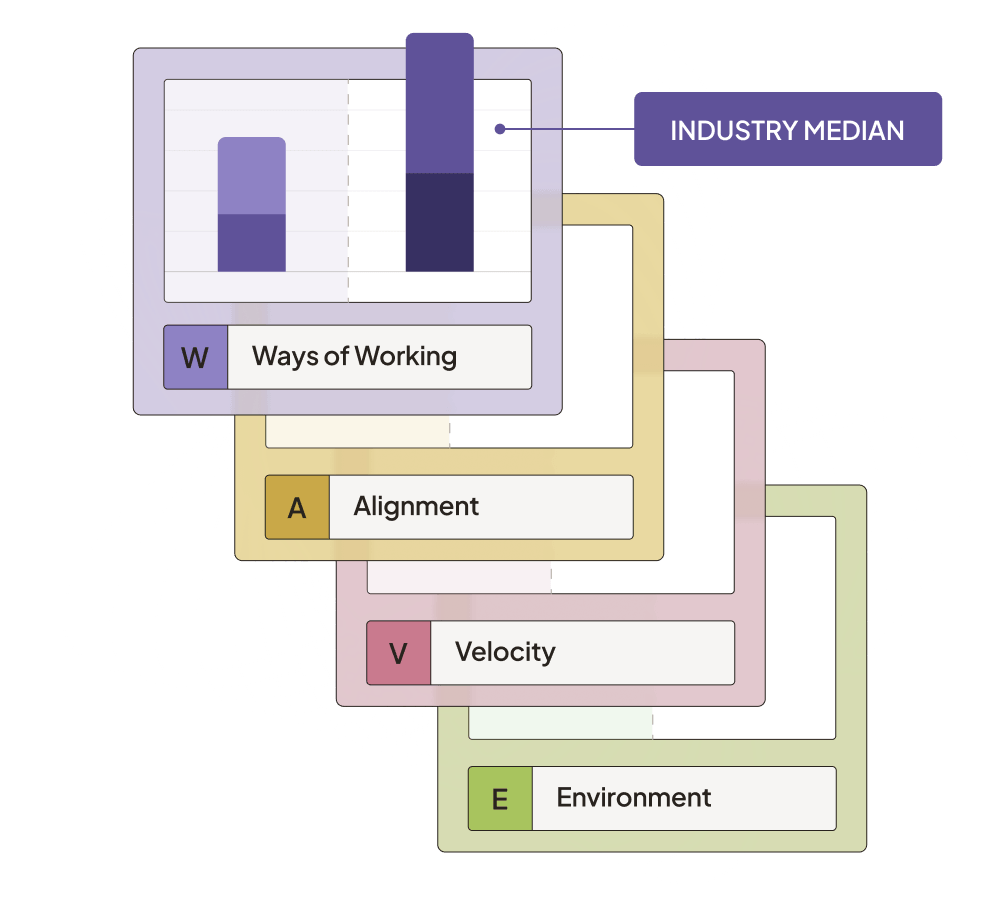
Cross-Organization Benchmarking: Uplevel enables comparisons across teams and even companies by standardizing data categorization. This allows leaders to see industry benchmarks for performance (and set their own internally), identify areas for improvements, and drive operational improvements.
-
Software Development Cost Capitalization: Bucketing work into R&D and non-R&D (KTLO and feature demand) categories provides a more accurate and easier way to create capitalization reports than asking engineers to self-report.
More allocation improvements on the horizon
While Uplevel’s current time allocation model is already creating positive results for customers, there is always more work to be done. For example, our data science team is working on ways to create even “smarter” allocation models that leverage machine learning and natural language processing algorithms. They can infer which PRs should be linked to which epics to provide even more accurate allocation. We’ll be announcing these improvements as they form on our roadmap.
Uplevel is the only engineering intelligence platform that combines technical performance, team performance, and allocation metrics with machine learning to provide engineering leaders with a holistic view of organizational effectiveness. Want to prove how Uplevel works with your team’s data? Schedule a demo today.