
Software engineering intelligence platforms all pull from the same underlying data — Git, Jira, CI/CD — but they don't do the same thing with it. Some are built for reporting R&D spend to a board. Some automate PR workflows. Some surface DORA metrics. This comparison breaks down eight platforms by what each one actually does, who it fits, and where user reviews say it falls short, so you can match the tool to the problem you're actually solving.
At a glance:
| Platform | Best for | Team size fit |
|---|---|---|
| Uplevel | Enterprise AI transformation | Enterprise (100+ developers) |
| Jellyfish | R&D investment reporting to a board | Enterprise |
| LinearB | Automated PR workflow policy | Small to mid-size |
| Swarmia | Developer experience alongside DORA/SPACE | Mid-size |
| Waydev | Broad framework + integration coverage | Small to mid-size |
| Code Climate Velocity | PR analytics + code quality in one tool | Small to mid-size |
| DX | Research-backed developer experience benchmarking | Enterprise |
| Athenian | No-frills DORA view, startups | Small teams, startups |
Why every engineering leader is evaluating SEI tools right now
AI coding tools have created more urgency around measuring engineering efficiency and effectiveness. Code generation has sped up. Whether that speed manifests as faster delivery or just moves the bottleneck downstream — into manual review queues and production incidents — depends on what was already true about the team before the tools arrived.
That vacuum is a big part of why the market for engineering intelligence platforms is accelerating: leaders want data to explain their progress in evolving toward an agentic SDLC. Some of the following platforms surface that story. Fewer explain it, and fewer still help a team do anything about it.
How these platforms compare
Evaluating a vendor on the right criteria is its own skill — what to ask in a demo, what real integration coverage looks like, how to weigh developer trust against management visibility. Uplevel's guide to evaluating engineering intelligence tools covers that ground in full. The short version, specific to the eight platforms below: each one gets evaluated on five dimensions.
- Delivery metrics depth — whether the platform predicts problems with leading indicators like PR complexity and focus time, or only reports lagging DORA numbers after the fact
- AI impact tracking — whether AI coding tool adoption gets connected to delivery outcomes, or just counted
- Business outcome framing — whether engineering effort maps to resource allocation and business outcomes a CFO or board can act on directly
- Full-lifecycle visibility — whether the platform covers planning and QA, or only the easy-to-instrument middle of the pipeline: commits, PRs, deployments
- Diagnosis and capability building — whether the platform explains why a metric looks the way it does and helps a team act on it, or stops at the number
Uplevel
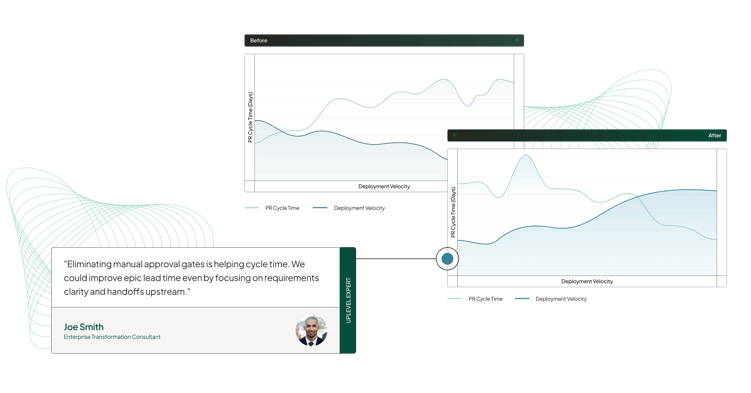
Uplevel is a system of transformation for enterprise engineering organizations navigating AI-driven change. The platform tracks full DORA, collaboration, and team-health metrics on an ongoing basis, and pairs that data with DevEx Discovery™ interviews and solutioning workshops that turn patterns into action. Capability building is at the forefront here; the goal is to help engineering teams build the agility to adapt to new challenges (AI today, and whatever comes next). Uplevel’s 45-day GearUp assessment sprint gets teams a working diagnosis of their top bottlenecks and a custom action plan without a six-month infosec rollout.
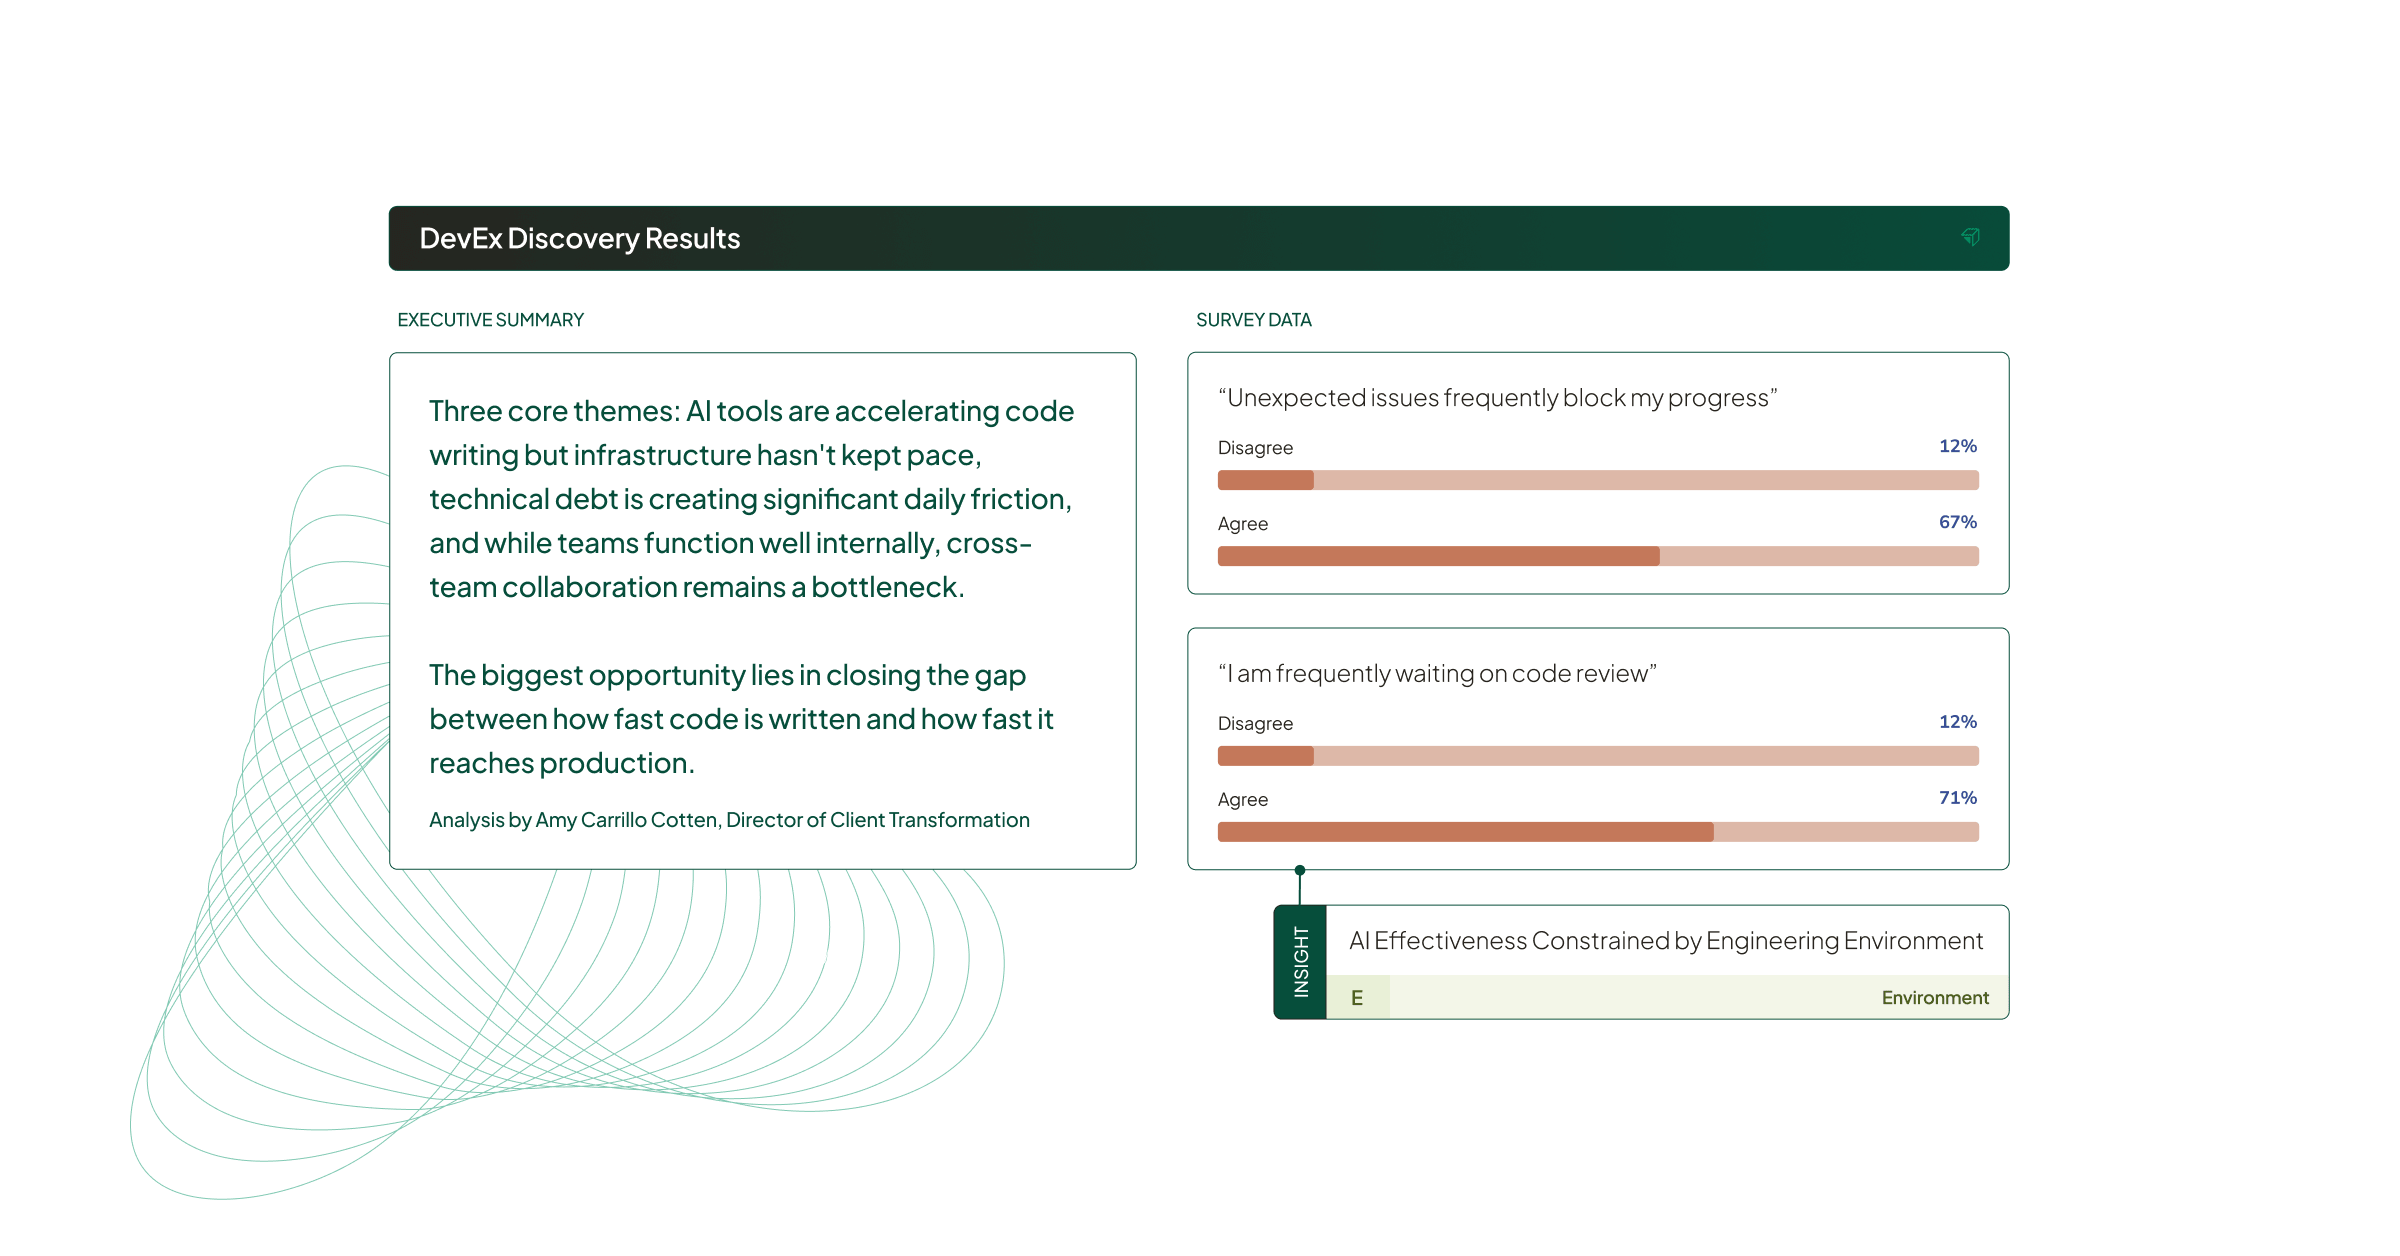
Key features: Continuous measurement across delivery and team health, DevEx Discovery™️ diagnostic interviews, GearUp assessment sprint, capability-building workshops, AI adoption and impact tracking across the SDLC.
Best for: Enterprise engineering organizations (100+ developers) driving org-wide AI transformation, not just AI tool adoption.
Where it falls short: The diagnostic and capability-building phases mean onboarding takes longer than a pure analytics dashboard. Teams looking for a self-serve setup they can configure in an afternoon, without executive sponsorship for a longer engagement, will find Uplevel's model asks for more organizational commitment than a point solution does.
Jellyfish
Jellyfish focuses on mapping engineering activity to business investment categories — new features, maintenance, tech debt — and turning that into reporting a CFO or board can read. Its DevFinOps module automates software capitalization reporting, the feature most often cited as the reason large R&D organizations choose it.
Key features: Engineering investment allocation, DevFinOps software capitalization, executive dashboards, AI cost and impact tracking, Jira-centric integration.
Best for: VPs of Engineering who need to present R&D spend and capitalization data to a CFO or board on a recurring basis.
Where it falls short: Multiple reviewers describe Jellyfish’s integration as a multi-week commitment before a team sees any data. One reviewer described the team falling into a pattern of micromanagement after adopting the platform's activity-level dashboards without enough context to interpret them, a dynamic they said took deliberate effort to unwind.
Cost data measures spend. Value is a separate, harder question, and most organizations answer it by default with whatever number is easiest to pull — for AI initiatives specifically, that's often token spend, treated as if it were a value metric.
LinearB
LinearB pairs DORA metrics with active workflow automation. Its gitStream feature lets teams define policy-as-code rules for PR routing, reviewer assignment, and merge conditions, and its WorkerB bot surfaces those signals directly in Slack and Microsoft Teams.
Key features: gitStream policy-as-code PR automation, WorkerB Slack/Teams bots, DORA metrics dashboard with cross-team benchmarking.
Best for: Teams that want automated PR routing and review policy enforcement built into the same platform as their delivery metrics.
Where it falls short: LinearB bills on a credit-based model, which reviewers note makes monthly costs difficult to predict as usage grows. Cycle time reporting stays at the aggregate level rather than breaking a PR into its five stages — coding, pickup, review, merge, deploy — so teams pinpointing exactly where work stalls need to dig further than the default view provides.
.png)
Swarmia
Swarmia pairs DORA and SPACE metrics with a 32-question developer experience survey and a working-agreements feature that lets teams set their own standards for PR size and review turnaround. Its AI measurement module detects pull requests assisted or created by Copilot, Cursor, and Claude Code.
Key features: Research-backed developer experience survey, working agreements, software capitalization reporting, PR-level AI tool detection.
Best for: Mid-sizel engineering organizations (30–300 developers) that want developer experience data alongside standard delivery metrics.
Where it falls short: Reviewers report that in-progress time analysis can be inaccurate, causing confusion when tracking workflow. Dashboard customization is another recurring complaint — pre-defined reports and sprint views are described as inflexible, with one reviewer calling the product "conceptually a great product" that "still needs polish to deliver on its promise across the board." The same reviewer noted Swarmia is built more for managers than individual contributors, who report difficulty extracting insight they can act on day to day.
Waydev
Waydev covers the widest range of frameworks in this list, combining DORA, SPACE, and its own DX module across more than 200 tool integrations. Its AI adoption module tracks how coding assistant usage correlates with delivery speed and code contribution patterns.
Key features: 130+ metrics, DORA + SPACE + DX framework coverage, AI adoption and ROI tracking, broad third-party integration support.
Best for: Large, distributed engineering organizations that want the widest integration footprint without adopting a workflow-automation layer on top.
Where it falls short: Several reviewers note that the sheer number of available metrics is overwhelming until a team narrows in on what actually matters to them. Some describe the developer experience survey module as still feeling raw, wanting more flexibility to combine subjective and objective data.
Code Climate Velocity
Code Climate Velocity pairs PR-level delivery metrics with code quality scoring. Its PR Resolution module breaks down exactly where a pull request lingers between open and merge, and its Data Hygiene view flags outliers before they skew a team's numbers.
Key features: PR Resolution stage breakdown, 60+ metrics, code quality and maintainability scoring, Data Hygiene outlier flagging.
Best for: Teams that want pull request analytics and static code quality analysis in a single platform rather than two separate tools.
Where it falls short: Reviewers report that a single outlier PR can skew results, and that cleaning up mistaken data requires manual validation rather than an easy correction path. Some also cite API reliability gaps, with one reviewer noting their team's endpoint was missing roughly 10% of expected records.
DX
DX combines developer experience surveys with SDLC analytics. Its DX Core 4 and Developer Experience Index (DXI) give engineering leaders standardized metrics for benchmarking against industry peers, and its DX AI module tracks AI-generated code by commit, PR, team, and repo.
Key features: DX Core 4 and DXI frameworks, biannual developer experience surveys, cross-company benchmarking, AI code tracking by commit and repo, executive reporting.
Best for: Large enterprises that want developer experience measurement grounded in published research, benchmarked against industry peers.
Where it falls short: Reviewers note that certain integrations are still difficult to configure. Several also note that some metrics require building custom dashboards through DX's AI-assisted SQL tool rather than getting them out of the box. As far as driving transformation, DX provides a rotating shortlist of improvement areas for leadership selected by developers, but does not offer follow-through or guidance for executing against them.
Athenian
Athenian keeps its interface deliberately narrow: velocity metrics, release tracking, and a mapping between planned Jira work and delivered GitHub pull requests, without individual-level scoring.
Key features: End-to-end delivery pipeline insights, Jira-to-PR mapping, custom release workflows, shareable views.
Best for: Small teams and startups that want a lightweight, no-individual-metrics view of delivery velocity.
Where it falls short: Reviewers describe the platform as presenting metrics "on the same level" regardless of relevance, making the signal hard to find without digging through everything else. Athenian's review volume is thin compared to the rest of this list, worth factoring into a long-term platform decision on its own. It's also a DORA-first tool at its core, the same limitation showing up across most lightweight platforms in this category.

How to choose
The right platform depends on which question a team is actually trying to answer. Organizations with very narrow use cases like presenting R&D spend to finance or incorporating code quality analysis to PR analytics might be best served by SEI tools like Jellyfish or Code Climate Velocity. Organizations wanting developer experience signals alongside delivery data might be best served by Swarmia or DX.
Driving enterprise-wide AI transformation, where the goal is organizational change and not just a detailed dashboard, points toward Uplevel.
Where Uplevel fits into engineering transformation
Every platform on this list can show what happened in a delivery pipeline last week. What’s actually needed in this market is being able to explain why and to know what to do next. That's the limitation running through the reviews above: metrics presented without enough context to act on, dashboards that need a dedicated analyst to interpret, data that surfaces a problem without pointing toward a fix.
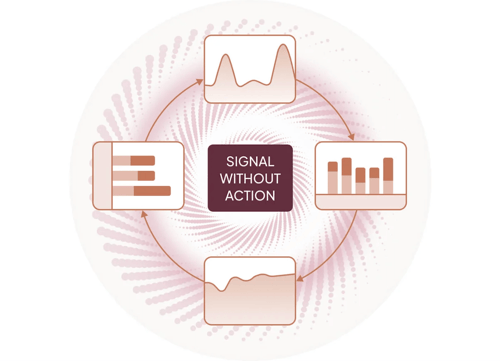
Differentiation in the software engineering intelligence market has shifted to diagnosis and capability building. Uplevel pairs continuous measurement with qualitative diagnosis to build a full picture of engineering health, not just delivery activity. That picture turns into a prioritized set of changes, built with the team rather than handed to them. The engagement also builds the organizational habits to keep identifying and addressing problems on an ongoing basis, so the improvement continues past the initial assessment.
Those ongoing habits are what eventually gives a leader something concrete to bring back to the board — evidence the organization is measurably better at solving its own problems.

Are you evaluating platforms from this list and need a starting point? Book a free 45-minute StackUp session with an Uplevel expert to evaluate your AI spend.


.png)
.png)