
The 2025 DORA report found that AI adoption now improves delivery throughput — but continues to increase instability, and the difference between organizations that capture the gains and those that absorb the dysfunction comes down to the underlying system, not the tools.
These findings raised a harder question than whether AI works.
What are developer productivity metrics actually measuring, and what accounts for the distance between what leaders expect to see and what the data shows?
Why do most developer productivity metrics fail to predict performance?
The dominant frameworks each represent a genuine attempt to measure engineering performance more rigorously. They share a structural limitation: they measure outputs and activity, not the conditions that determine whether those outputs translate into outcomes.
DORA metrics (deployment frequency, lead time for changes, change failure rate, and MTTR) come with established developer productivity benchmarks and remain the clearest picture of pipeline health available. They are also lagging indicators.
The conditions that determine whether the pipeline is pointed at anything that matters — priorities, planning quality, team alignment — are outside DORA's scope.

The SPACE framework (Satisfaction, Performance, Activity, Communication, Efficiency) recognized that productivity was multidimensional and tried to capture more of those conditions. Its limitation is prioritization: without guidance on which signals matter most or what good looks like, engineering leaders have a richer picture and the same problem — they still can't tell what to fix.
DX Core 4 addressed SPACE's operationalizability problem by making specific choices: "diffs per engineer" as a throughput proxy, the Developer Experience Index as a standardized satisfaction measure.
Specificity is progress. But picking a specific metric and picking the right metric are different decisions. "Diffs per engineer" is concrete and gameable. DEI captures something real about how engineers experience their work — and still tells you little about the conditions producing that experience or what to change.
The problem these frameworks share: they tell you what engineering produced, not what conditions made that production possible — or whether those conditions can sustain it. That problem compounds when metrics are applied at the individual level.
What's wrong with measuring individual developer output?
Molly Graham's Waterline Model makes an observation that applies directly to this problem: the instinct to diagnose underperforming teams at the individual level is usually a leadership trap. Most team performance problems are structural.

A team missing commitments because of unclear requirements, cross-team dependencies, or context-switching pressure looks identical in those metrics to a team that is simply performing poorly. Acting on individual metrics when the constraint is systemic misattributes the problem.
It also creates pressure to perform the metric. Engineers write more diffs when diffs are tracked. Teams close more tickets when tickets closed is the signal. AI has sharpened this further: the same output — a feature shipped, a bug fixed — might come from an engineer who wrote every line or one who directed agents to write most of it. The underlying work may have been equally demanding. What makes measurement fair is the same thing that makes it accurate: keep it aggregated at the level that reflects shared conditions, not individual output.
How does AI change what "developer productivity" means?
AI has moved the primary bottleneck in software development away from code generation — and that shift is what makes traditional developer productivity metrics actively misleading.
Most developer productivity metrics and developer efficiency metrics were designed for a job where engineers wrote most of the code themselves. But the engineers delivering the most value in AI-native organizations are spending less time writing code and more time on judgment-intensive work: determining what's worth building, evaluating whether AI-generated output is correct and secure, and maintaining the architectural and contextual decisions that require human judgment.
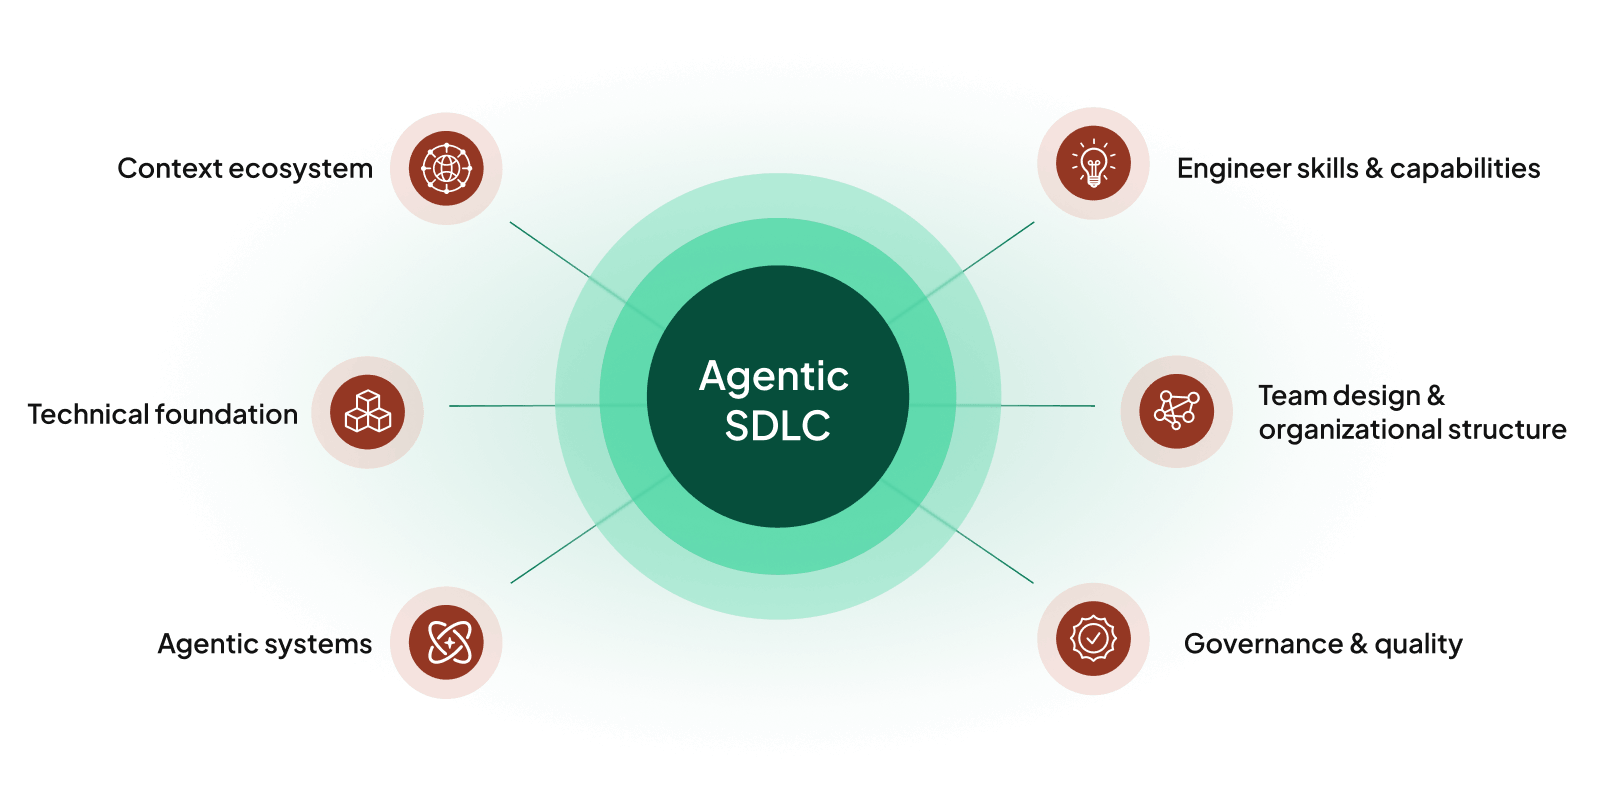
The agentic SDLC is the organizational state most engineering leaders are trying to reach. Organizational trajectory is a systems-level question: "how effectively is this system converting engineering effort into outcomes?" On the surface, it might look similar to "how productive is this developer?" But individual coding metrics measure a different layer that barely scratches the surface of true transformation.
Which developer productivity metrics actually tell you something?
The signals worth tracking are systemic. They measure the conditions that allow engineering effort to produce outcomes — and they're the leading indicators that tell you whether AI acceleration will help or expose problems that were already there.
Focus and flow time
Uninterrupted deep work — blocks of two or more hours on complex work — is one of the strongest predictors of engineering output quality Uplevel's research has identified. Context-switching between too many concurrent projects is one of the most common system constraints hiding behind other symptoms. Teams where focus time has eroded will show delivery problems that resist explanation from other metrics.

Allocation of effort to stated priorities
What percentage of engineering capacity is going to the work that matters most right now? Actual time allocation data regularly surfaces patterns that contradict stated roadmap priorities. This is a systemic indicator: it tells you whether planning and prioritization are working. Individual engineer productivity is a separate and secondary question. One large enterprise Uplevel worked with discovered that engineering effort was substantially off-plan against H1 goals — a pattern that manual analysis hadn't surfaced, and that had been compounding for months.

Quality as a system property
Bug rates, incident frequency, and code review effectiveness are signals about your entire development system — your AI tooling, your review processes, your test infrastructure, and your deployment pipeline. In organizations with significant AI adoption, these signals need to be tracked before and after adoption to understand what AI is actually doing to output quality. License utilization tells you how widely AI tools have been adopted. Defect rate trends tell you what those tools are doing to the system.

Team health
These signals live in survey data and interviews. Psychological safety, clarity on priorities, and confidence in the engineering system are leading indicators for almost everything else. Teams with high psychological safety surface problems earlier, sustain improvement over time, and adapt when conditions change. Teams where psychological safety is low tend to optimize for appearing productive — a pattern that standard developer productivity metrics rarely surface.

How Uplevel approaches measuring engineering productivity
Engineering leaders working with Uplevel typically arrive with a clear picture of their pipeline health metrics and a much murkier picture of what's underneath. They know their deployment frequency and their cycle time. The questions that take longer to answer from standard metrics: what's driving focus time decline, which teams are working off-roadmap against stated priorities, and what AI adoption is doing to defect rates.
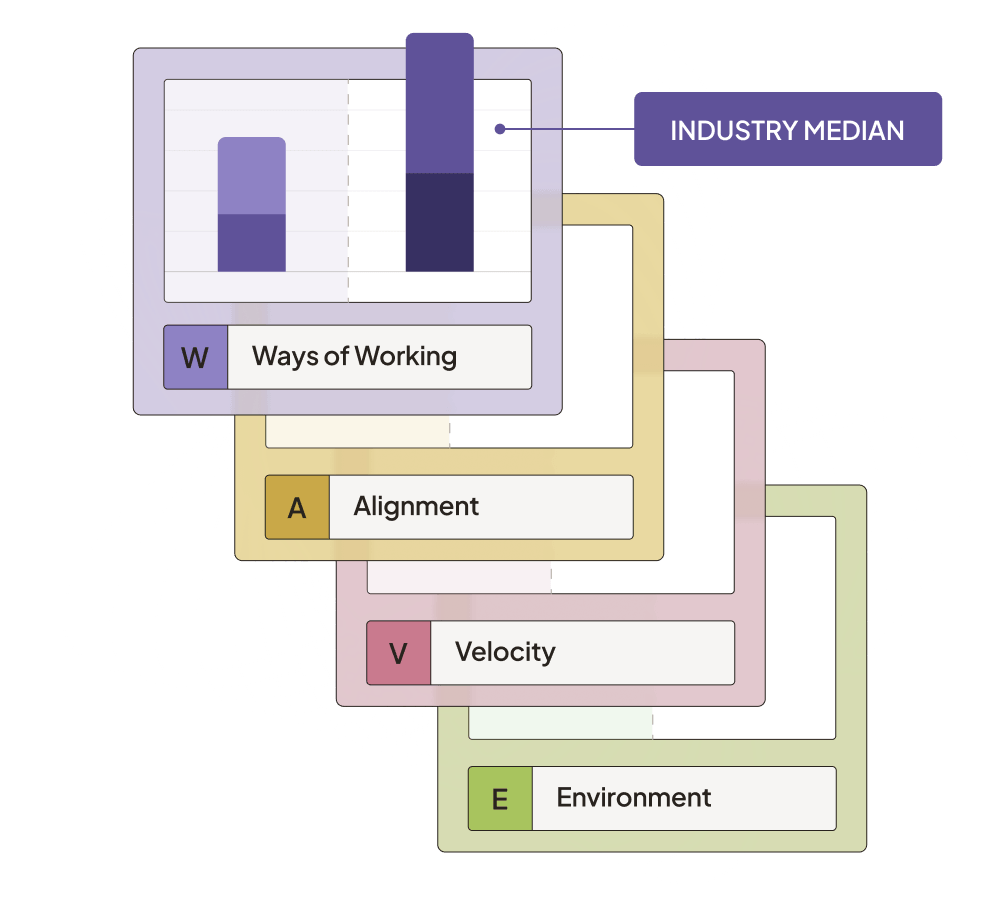
Uplevel combines continuous measurement across the WAVE framework dimensions — focus, alignment, velocity, code quality, and environmental conditions — with qualitative data from surveys and developer interviews that surface the reasons behind quantitative patterns. The result is a picture of engineering performance at the system level, with enough context to know what to change and what to leave alone.


.png)