
.png)
At the sprawling headquarters of GSS Healthcare, the newly appointed CTO, Bill Lumbergh, was about to face one of his biggest challenges yet.
 The company was on the cusp of a massive digital transformation, integrating virtual appointments, online scheduling and pharmacy services, and electronic medical records into a comprehensive digital platform that would keep GSS competitive and aligned with consumers’ expectations.
The problem? Bill had just had an executive call with the CEO and CFO on the next year’s engineering budget, and he was lost. The transformation was running behind, but without knowing how much time teams were spending on different initiatives across the organization, he couldn’t make a compelling case for more headcount.
With the pressure mounting, he summoned his top four VPs of Engineering to an urgent meeting.
Bill needed to know what projects were consuming his teams' time. As he pondered his next move, the door swung open, and his VPs filed in:
-
Dilbert, leading the core product teams
-
Cameron, in charge of the teams from Tyrell, a recent telehealth acquisition
-
Bertram, leading platform engineering
-
Sadie, managing analytics service delivery

"Thank you all for coming on such short notice," Bill began. "We need to pivot our strategy and I need a clear picture of what every team is working on. Effective immediately."
Dilbert, the VP with the longest tenure, spoke first. "Bill, our teams are already stretched thin. We’ve got multiple initiatives ongoing — new features, maintenance, bug fixes. But I can get my TPMs to compile the data into reports and get back to you."
Bill frowned. "How long will those TPS reports take?"
Dilbert hesitated. "A few weeks, at best. We’ll have to call several meetings, gather reports from GitHub and Jira, and make sense of it all."
Cameron interjected, "That’s the issue right there. On the Tyrell teams, we inherited a different system. We’re still using GitLab, not GitHub, and our naming conventions for epics and projects in Jira are completely different from the rest of the company. So our reporting process is going to have to be more or less entirely manual to compare apples to apples, which will take a couple more weeks."

Bill’s frustration was palpable. "This is exactly what we need to fix. Cameron, can your team adapt to our tools?"
She shook her head. "Not without significant downtime and training. It would disrupt our workflow entirely."
Bertram leaned forward. "Look, the platform teams track everything in terms of operational metrics. But translating those metrics into the kind of report you’re asking for... it’s going to be a nightmare. We use story points for planning, but it’s inconsistent. One team’s story point could be an hour’s work, while another’s might be half a day or more."
Sadie sighed. "And we’re no better. Our developers are supposed to log their hours in a spreadsheet every day. But honestly, compliance is low. They’re too busy actually working and they resent the process because it feels invasive."
.png?width=180&height=180&name=facepalm%20(2).png)

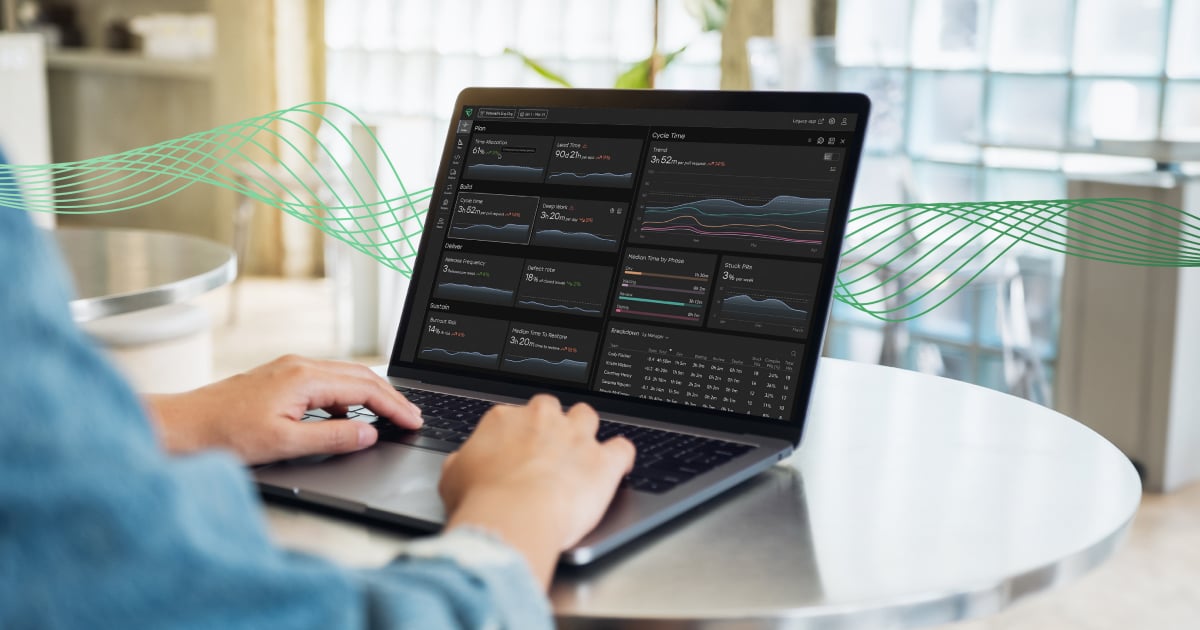
Let’s walk through how Uplevel solves the “what are all of our teams working on?” problem.
Why Time Allocation?
Why time, and why not story points? Because story points don’t tie directly to time, in most cases. They are used for planning, but don’t adapt to the dynamic reality of engineering, which might include unplanned P0 bugs or incidents. Some teams use one story point = one hour. Others say that each developer should try to pick up eight story points in a two-week sprint. There is no right answer and no single best practice; the entire purpose of story points is to estimate the level of effort in advance.
There is one great equalizer to understand an engineering organization’s investments: time.
Whether you’re a 14th-year principal or a first-year SDE, there are still 24 hours in a day, and 8+ hours in a work day. That day will be messy, filled with and broken up by various levels of meetings, interruptions, collaborating with the team on design specs, writing code, committing, reviewing PRs, and communicating those changes back via the associated tickets.
That’s where we start.
Sourcing the Data
Uplevel's analysis of developers' available workdays begins by identifying calendar events, chat interruptions, and out-of-hours work.

By examining calendar data, Uplevel can track various meetings and accurately account for developers' time, helping managers understand where time is lost and how to optimize productivity. Chat interruptions, such as a junior developer seeking help from a senior developer, are also analyzed to measure their impact on workflow. Uplevel’s models, including the Meeting Classifier, Meeting Reconciliation algorithm, and Conversation Segmentation Analyzer, provide insights into how meetings and chats affect developers’ available working time.
Additionally, our Always On model tracks irregular and extended work hours to give a comprehensive view of developers' schedules, considering varied and shifting work patterns. This holistic approach helps leaders understand and manage the allocation of time effectively.
Want to learn more about how it works?
Check out our deep dive into the data science behind Uplevel’s time allocation model.
Tying It All Together
With a sense of each person's available development time, we can estimate how that time is spent and how it fits into the engineering organization's overall goals. Uplevel's Allocation Model, along with the Allocation Rules Engine and a machine learning model, helps classify work items.
 Imagine a developer with 4.5 hours of available work time after meetings and interruptions switching between two projects on a typical day: an urgent bug ticket from the Monday morning scrum and an eight-point story they've been working on. The day involves writing, testing, and committing code for the bug fix, opening a PR, then returning to the larger story until the PR reviewer provides feedback. The developer then tweaks the bug fix, re-commits, submits for review, and marks it as “Done” once merged.
By proportionally splitting the developer's available time across their tasks—commits, ticket statuses, comments on reviews, and other metadata—Uplevel's models can estimate time allocation: the developer spent 4% (roughly 90 minutes) of their week working on the bug ticket, and the reviewer spent less than 1% of their time doing the review.

Commits, comments, and code changes are attributed to the PR author and reviews to the reviewer, not just the final ticket assignee. Uplevel also links PRs to issues if an issue key appears in the title, branch, or PR description.
Allocation made smarter
Because people are people and data is messy, there is a lot of inconsistency in how — and whether — Uplevel receives activity data. Here’s how we tackle some of the most common variations (and you can dive deeper into the science here):
Lack of activity data
Some days may show no Jira or Git activity if a developer is thinking, researching, or documenting without making code commits. When this occurs, Uplevel interpolates the most likely activity, looking at what is currently in flight and using the most recent issue and PR activity for estimates.
Lack of standardized project management
Some teams use built-in Jira hierarchies, others custom fields, and still others use both. Uplevel’s Allocation Rules Engine can leverage parent-child relationships between Jira issues and the existence of custom fields at various levels to determine the type of work when this data is inconsistent.%20(1).png?width=600&height=424&name=Jira%20Hierarchies%20(1)%20(1).png)
Uncategorized work
Getting an entire organization to fill out a custom field has diminishing returns. Uplevel has developed a machine learning model that categorizes issues into “New Feature Work,” “Sustenance,” and “Defects,” rounding out the picture when custom fields aren’t filled out or issues lack a parent.
Seeing Distribution of Work
Allocation View: Work Type
The primary question that Bill and his VPs are looking to answer is how their teams’ time is being spent across major categories: new value, technical debt, and failure demand work. To do this, they’ll use Uplevel’s Work Type view.
Using Uplevel, they can see this data instantly and without time lag — even if different teams have different ways of working and different ways of categorizing work. Each VP can segment their report by a number of variables, such as business unit, report group, and manager, and select the desired timeframe. Bill might be a level removed, preferring to look at engineering time allocation overall and drilling down as needed.
All of these views are available within the dashboard, where the leaders will be able to see the percentage of total effort against each of those categories:

This enables leaders to make decisions based on how they’re performing against desired benchmarks (such as a minimum of 20% new value work). It also allows leaders like Bill to be prepared for presentations with the board without requiring their team to go “pull the report and do the analysis” or rely on hindsight estimates.
Tracking Key Engineering Initiatives
Allocation View: Objective
Say that Bill is feeling pressure from business stakeholders to release virtual appointments as that will allow greater access to care — and more appointments mean more revenue for GSS. But Dilbert wisely identifies online scheduling as the actual priority as patients need to be able to schedule the virtual appointments before they see a doctor.
Prior to using Uplevel, “progress” on key initiatives might have been tracked manually in Jira or other project management tools. But Dilbert’s core product team only has so many hours in the day, and they might feel pressure to inflate their deployment numbers toward one initiative or the other to ensure that the report looks favorable to their preferred leader. This could be implicit, but it’s important that Bill and Dilbert are getting unbiased reports from their teams.
Using Uplevel’s Objective view, both Dilbert and Bill can gain more transparency into the specific initiatives that are actually taking developer time. In the example below, a whopping 47 epics weren’t tied to a business objective but still took up 3x the developer time as the next labeled objective:

This is a great opportunity for leadership to dive into what those things are, why they were worked on, and why they aren’t tied to a business objective.
Matching Effort to Project Scope
Allocation Unit: FTEs
GSS Healthcare’s engineering teams work collaboratively. Projects owned by Dilbert’s team require collaboration from Cameron and Bertrand’s, and Sophie’s analytics services touch all of the other teams as well. With their current tools, it’s difficult and manual to figure out who is working on which projects — and it’s more than is easily captured in Jira where each task, story, issue, or project only has one “owner.”
Looking at objectives but changing the unit to FTEs, the leaders can view the effective number of full-time engineers working on each project for a given time period. This will allow them to recognize where there should be adjustments either to project scope or allocation.
For example, we can see that in this reporting group of 12, there are effectively 8 FTEs this quarter when accounting for meetings, time out of office, etc.:

Let’s assume that INIT-19 is a key initiative, but we see here that the company is investing just over 1 FTE when accounting for everything else that’s in flight. While simply assigning more engineers to the problem isn’t always the answer, there are likely opportunities to investigate if the initiative has the right level of resourcing for the priority and predicted impact.
Financial Reporting
It’s the end of the quarter, and the board is ready for another update on what engineering has spent over the past three months.
Last quarter, Bill and Cameron were scrutinized for how much spend there was with so little “value delivered,” even though Cameron’s team was in the midst of a massive infrastructure project to integrate the Tyrell telehealth platform and eliminate years of accumulated tech debt. But still, there were questions of how much time and cost that really required.
More Pain: Tax Capitalization Reporting
There are huge tax incentives to prioritize research and development as opposed to support and maintenance. But those incentives require justification and documentation that time was spent investing in those areas.
 In the past, this reporting meant that every single engineer had to spend roughly an hour going back through what they did in the past quarter. It took their manager another two hours to twist everybody’s arms and do a rough audit of the data.
Suppose that there are 900 devs, and 100 managers in our example here, and everybody makes a $100K salary, which works out to being $50/hr. To produce this report, it’s going to cost $55,000 dollars (900 x $50/hr x 1 hour + 100 x $50/hr x 2 hours). In addition, that’s time not being spent on the work that they should be doing to generate value for the company.
If this reporting process happens 4x per year, that’s $220,000 dollars just to understand what people did. In reality, engineers would rather underestimate than do the forensic analysis to prove that the time was spent on R&D. This translates to even more lost for the company in terms of tax incentives.
By pulling allocation at the individual level, and comparing that against salary data (since compensation can vary wildly across experience and geography), it’s possible to break down that engineering spend into tangible buckets to see if the team is over-investing in one area compared to another.
What are the most expensive people working on: the highest priority R&D projects or technical debt?

Being able to prove this quantitatively rather than relying on surveys or expensive and inaccurate wild goose chases gives the GSS teams the ability to bring data to the table to justify their investments.

Allocate Engineering Time Effectively
Skip the guesswork. Uplevel automatically ties engineering work to initiatives, even if product data is messy, so you can meet commitments.

Optimize Technical Performance
See industry-standard DORA metrics plus the leading indicators that make them actionable, like PR complexity and epic lead time.

Improve and Sustain Team Performance
Understand the hard-to-surface work patterns and root causes of developer toil that influence value delivery and efficiency.
Ready for a clearer engineering roadmap?
Schedule a demo today and find out how leaders use Uplevel to engineer top engineering organizations.
.png)