
Boards want a number on AI's return, and engineering leaders are the ones expected to produce it. The pressure repeats every quarter: prove the investment is working, prove the team is producing more, prove it in terms finance will accept. The numbers already on hand — deployment counts, story points, AI adoption rates — rarely survive the follow-up question. A board asking why productivity gains haven't shown up in delivery, or why bug reports climbed the same quarter deployments did, is asking something activity-tracking dashboards can't answer.
That pressure is exactly why developer productivity is worth defining precisely — starting with what the term should mean now.
What is developer productivity?
What's most important to remember is that it's a system-level property. The system includes the engineers, and it also includes the requirements process, review capacity, deployment pipeline, and the judgment applied to what AI produces.
The definitions in circulation collapse that entire system of value into a volume metric: PR counts, commits, tickets closed. It was an oversimplification before AI, and the problem accelerated the moment code generation did.
Why do standard definitions get it wrong?
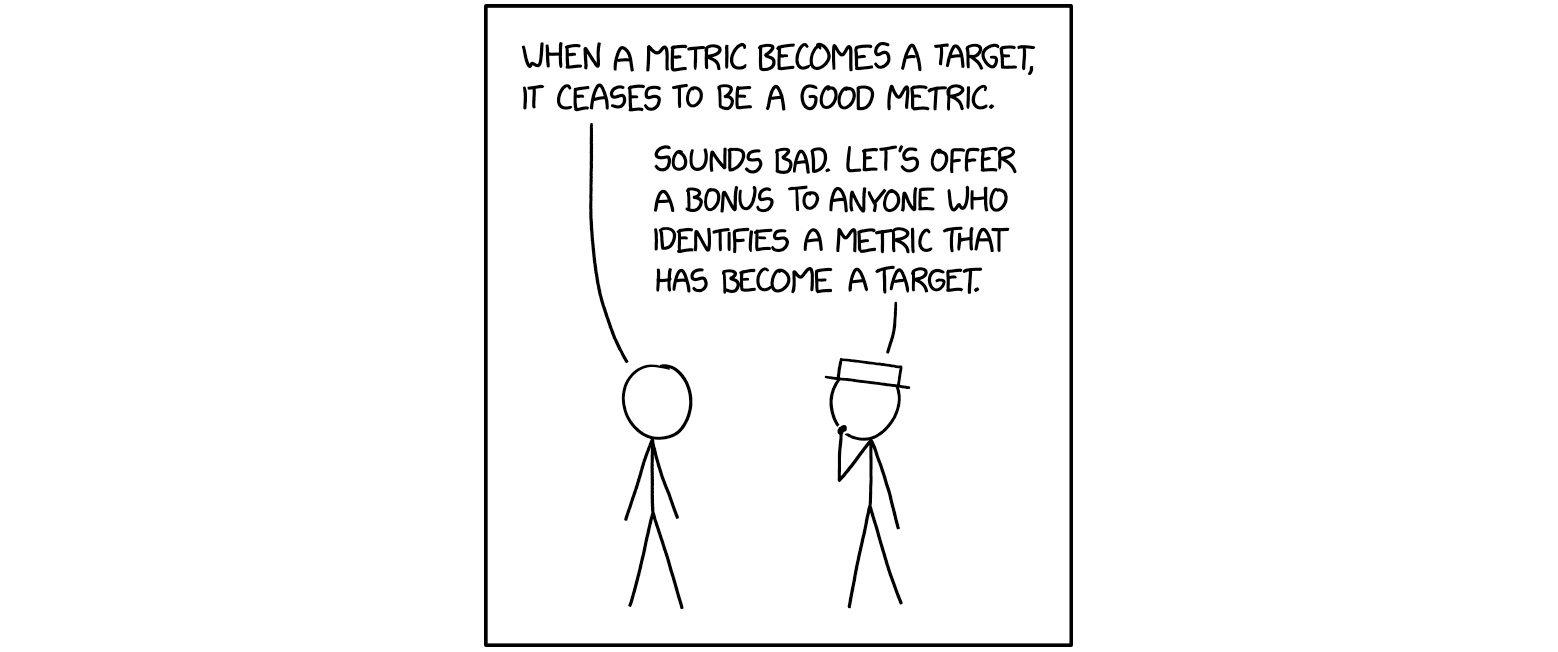
Individual output metrics measure the easiest thing to count. That's a different problem than predicting performance. Goodhart's Law explains why that stays broken: once a metric becomes a target, people game the metric instead of the outcome it was meant to represent. Track diffs per engineer, and diffs climb. Track tickets closed, and tickets close faster, whatever happened to the underlying problem those tickets were supposed to solve.
AI turns that old inconvenience into a measurement failure. The same shipped feature can come from an engineer who wrote every line or one who directed an agent to write most of it — effort and output have decoupled, and activity metrics can't tell the two apart. DORA's 2026 ROI report puts a name on what fills that space: AI "serves as a powerful amplifier in software development" that "magnifies the strengths of high-performing organizations and the dysfunctions of struggling ones."
Amplification cuts both ways. It rewards organizations that already measure the right layer, and it punishes the ones that don't — faster than either group expects.
How has AI changed what developer productivity means?
AI moved the bottleneck from writing code to directing and judging it. The much scarcer skill now is deciding what's worth building, catching what AI-generated output gets wrong, and holding the architectural context an agent doesn't have. Organizations still measuring story points are measuring a skill that matters less every quarter (and one that doesn't even reflect the work engineers do now).
DORA's 2025 research measured both: individual effectiveness was the strongest positive effect of AI adoption across every outcome studied. Software delivery instability was the second strongest effect — and it went the wrong direction. Burnout held steady. Friction held steady. Organizational performance barely moved.
The reason, as the DORA ROI report describes it, is a verification tax: the effort saved from writing boilerplate gets replaced by the cognitive load of auditing AI-generated code that looks correct and often isn't. Coding moves faster, while the system around it absorbs the cost.
Individual speed and organizational productivity are separate measurements. An organization that tracks only the first will misread what's happening to the second — usually for months, and until stakeholders start asking deeper questions.
What happens to organizations that keep measuring the old way?
It takes a while for downstream effects to show up in data, especially when orgs aren't measuring developer productivity at a systemic level. Individual commit counts climb because AI makes code generation faster. But that volume has to move through review, and without intentional changes to automate reviews at scale, it creates a bottleneck. The speed that showed up on the individual dashboard gets absorbed by the system before it reaches a customer.
What the dashboards report and what's actually happening in the pipeline pull further apart every time the organization keeps measuring at the individual level, and the shift stays invisible because the numbers that would reveal it — focus time, quality trends, allocation of effort against priorities — sit outside what most organizations already track.
Here's an example of how identical metrics can mean very different things when you uncover the systemic root causes:
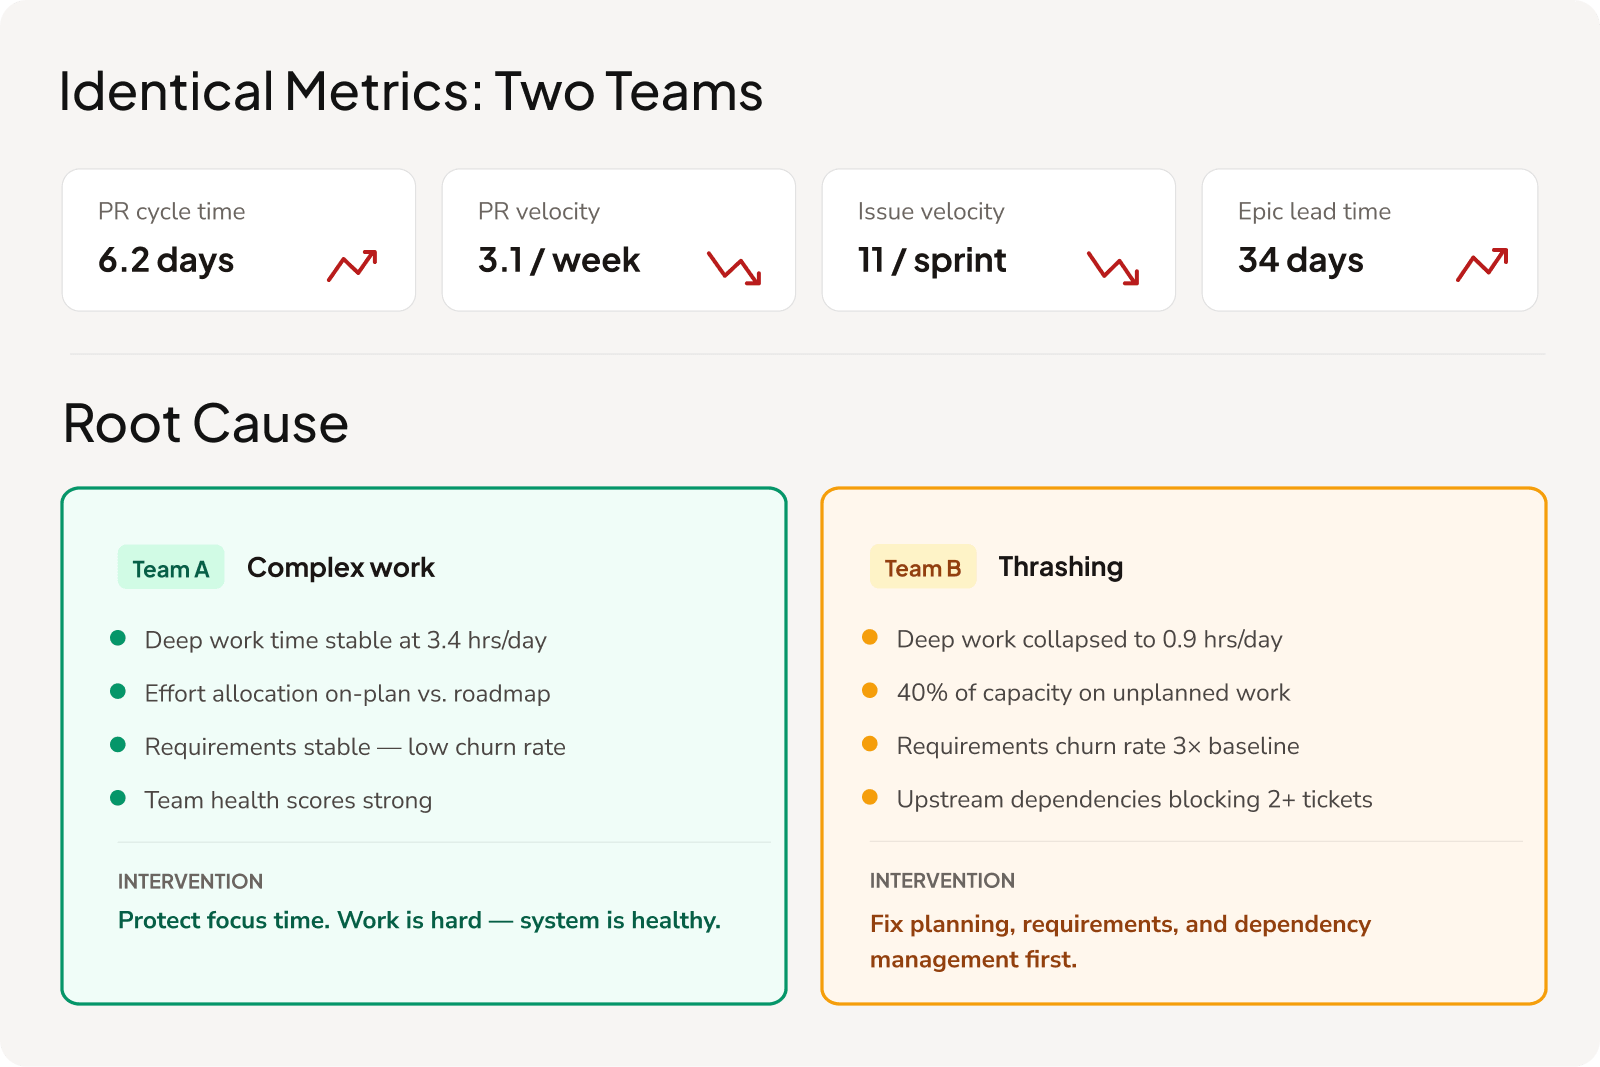
By the time the failure shows up, it shows up as a system-level event: a security incident, a burnout wave, a board asking why AI adoption hasn't moved the needle. Systemic data — focus time, quality trends, allocation — surfaces every one of these problems long before commit counts do.

What does developer productivity actually look like in practice?
In practice, developer productivity begins to move when organizations change what they measure: the conditions engineers work inside.
For example, Accolade's engineering organization increased deployments 205% and deep work 20% after shifting its focus from individual output to those conditions. Xactly found that closing the distance between what standard tools showed — little, given inconsistent Jira hygiene — and what was actually happening required time-allocation data beyond ticket tracking. Available developer time rose 17%.
But measurement alone doesn't sustain productivity — it reveals where to act. The organizations that see gains hold over time are the ones that treat what the data surfaces as a starting point for capability building: fixing the structural conditions that constrain engineers and developing the judgment the work now requires — what to build, how to sequence it, what context to bring, and whether what came back is actually correct. Measurement tells you what's happening. What you do with that picture determines whether the improvement compounds.
Why do engineering dashboards miss the problem?
Because engineering dashboards were designed for a different version of software development. An organization measuring the wrong thing precisely is still measuring the wrong thing.
Engineering organizations running DORA, SPACE, or something homegrown have a framework producing numbers, a dashboard displaying them, and someone reviewing them monthly. The problem is rarely a lack of metrics. But the metrics in place were selected for a version of the work that has already changed. A DORA dashboard built around deployment frequency and lead time for changes still works for what it was designed to measure. It wasn't designed to measure whether the verification burden from AI-generated code is landing unevenly across the team.
An organization can hit elite DORA benchmarks and still have a productivity problem it can't see — because the productivity problem lives in the layer the framework wasn't built to reach. Which signals actually hold up under that pressure is a different and deeper question, and the selection matters more now than it did two years ago.
How Uplevel approaches developer productivity
Engineering leaders are likely already holding a dashboard that looks fine, and a feeling that the full picture lives somewhere else. That instinct is usually correct. Individual activity counts can stay stable or trend upward for months while focus time erodes, allocation drifts off the stated roadmap, deployment flatlines, and quality degrades under AI-generated volume — and every one of those patterns stays invisible to the tools most organizations already run.
Uplevel combines continuous measurement with contextual understanding and capability building to drive sustained engineering transformation. That means tracking the systemic signals that predict performance — focus time, allocation of effort against stated priorities, and CI/CD practices — paired with qualitative interviews that explain why the patterns exist. Engineering leaders walk away knowing whether the underlying system converting their effort into outcomes is getting stronger or coming apart, which is the question the dashboard was never built to answer.
Frequently asked questions


.png)