Uplevel now lets you add contextual notes directly to dashboard views. When you annotate a metric, the system preserves your exact query parameters, filters, and time ranges — so anyone viewing that data later gets both the numbers and the explanation.
The Problem with Engineering Metrics
Engineering metrics show what happened on any given day, but they don't explain why.
When leaders see a spike in cycle time or a drop in throughput, they typically hunt through Slack to find out what happened. Managers spend time proactively documenting explanations to prevent those questions. The data and its context live in separate places, requiring manual coordination every time.
This creates two failure modes: leaders either waste time tracking down explanations, or they make decisions based on incomplete information.
What Context Does
Context solves the coordination problem by letting teams annotate metrics where they live.
Add a note to any dashboard view. The system automatically captures:
- Your annotation (what happened and why)
- The exact time range you were viewing
- All applied filters and segments
- Who added the context and when
Leaders viewing that data see an indicator that context exists. Click it to read the annotation and revert to the commenter's exact view — no guessing what filters were applied or what period they were analyzing.

Specific Use Cases
- Explaining anomalies: Document outages, team absences, tooling migrations, or dependency changes that affected metrics
- Recording retrospective insights: Capture what the team learned during sprint reviews, anchored to the actual data
- Flagging measurement issues: Note known problems with data collection or reporting
- Documenting decisions: Record changes to process or tooling that will affect future measurements
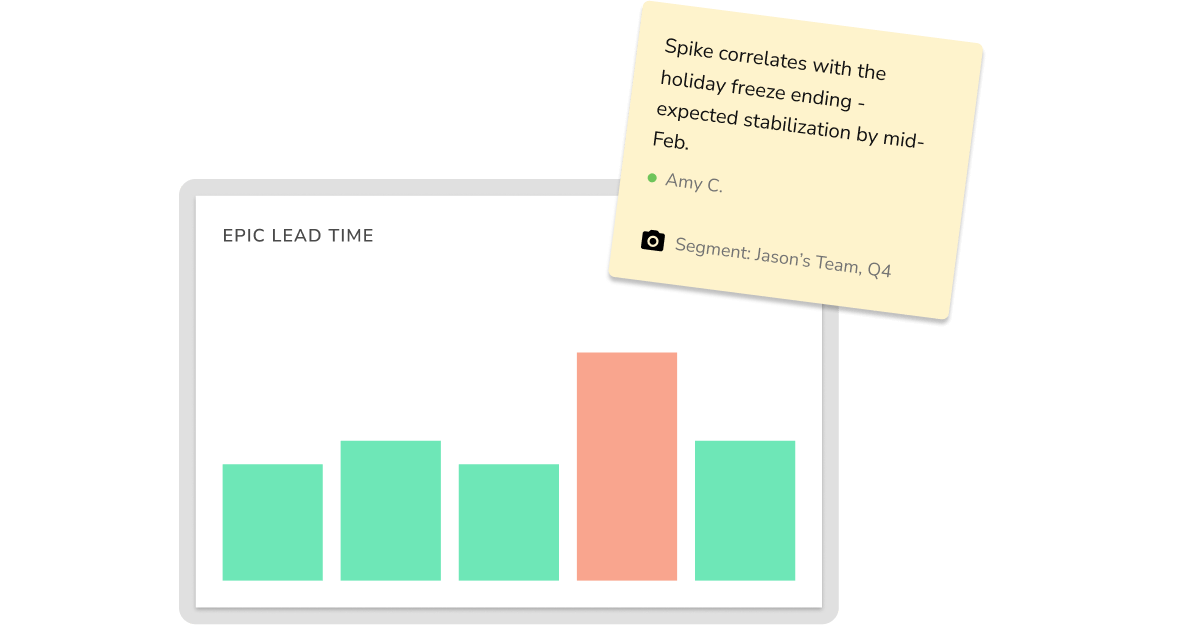
Imagine you're reviewing cycle time for August and see there's a significant spike. You click the context indicator and see: "Two engineers out sick with COVID for two weeks. X service outage slowed work while we troubleshot it."
With understand the spike immediately. No Slack threads, no assumptions. The explanation now lives with the data.
Context in Context
At Uplevel, we understands that engineering effectiveness is a sociotechnical challenge. Technical metrics interact with team dynamics, organizational changes, and external factors that don't appear in dashboards. Context makes that relationship explicit by preserving the organizational knowledge that helps leaders interpret what the data actually means.
This doesn't replace the hard work of deep, continuous change. But tools can be catalysts to make change easier. With Context, Uplevel removes friction from a specific problem: making sense of metrics when the people who understand the context aren't available.
Context is available across all metrics in Uplevel. Full documentation here.


![Top Engineering Intelligence Platforms [2026]](https://uplevelteam.com/hubfs/top-engineering-intelligence%20(1).png)