PLATFORM
The engineering dashboard that enables real change
You don't need another BI tool that collects more dust than data.
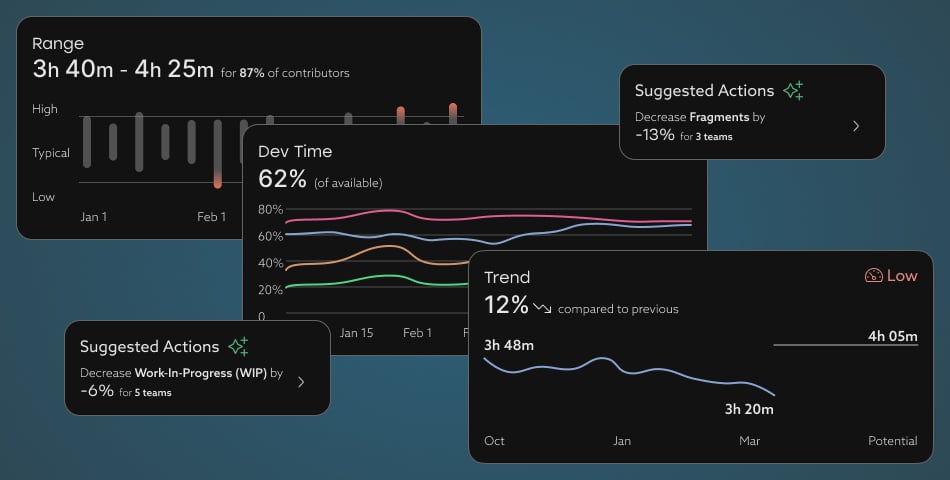
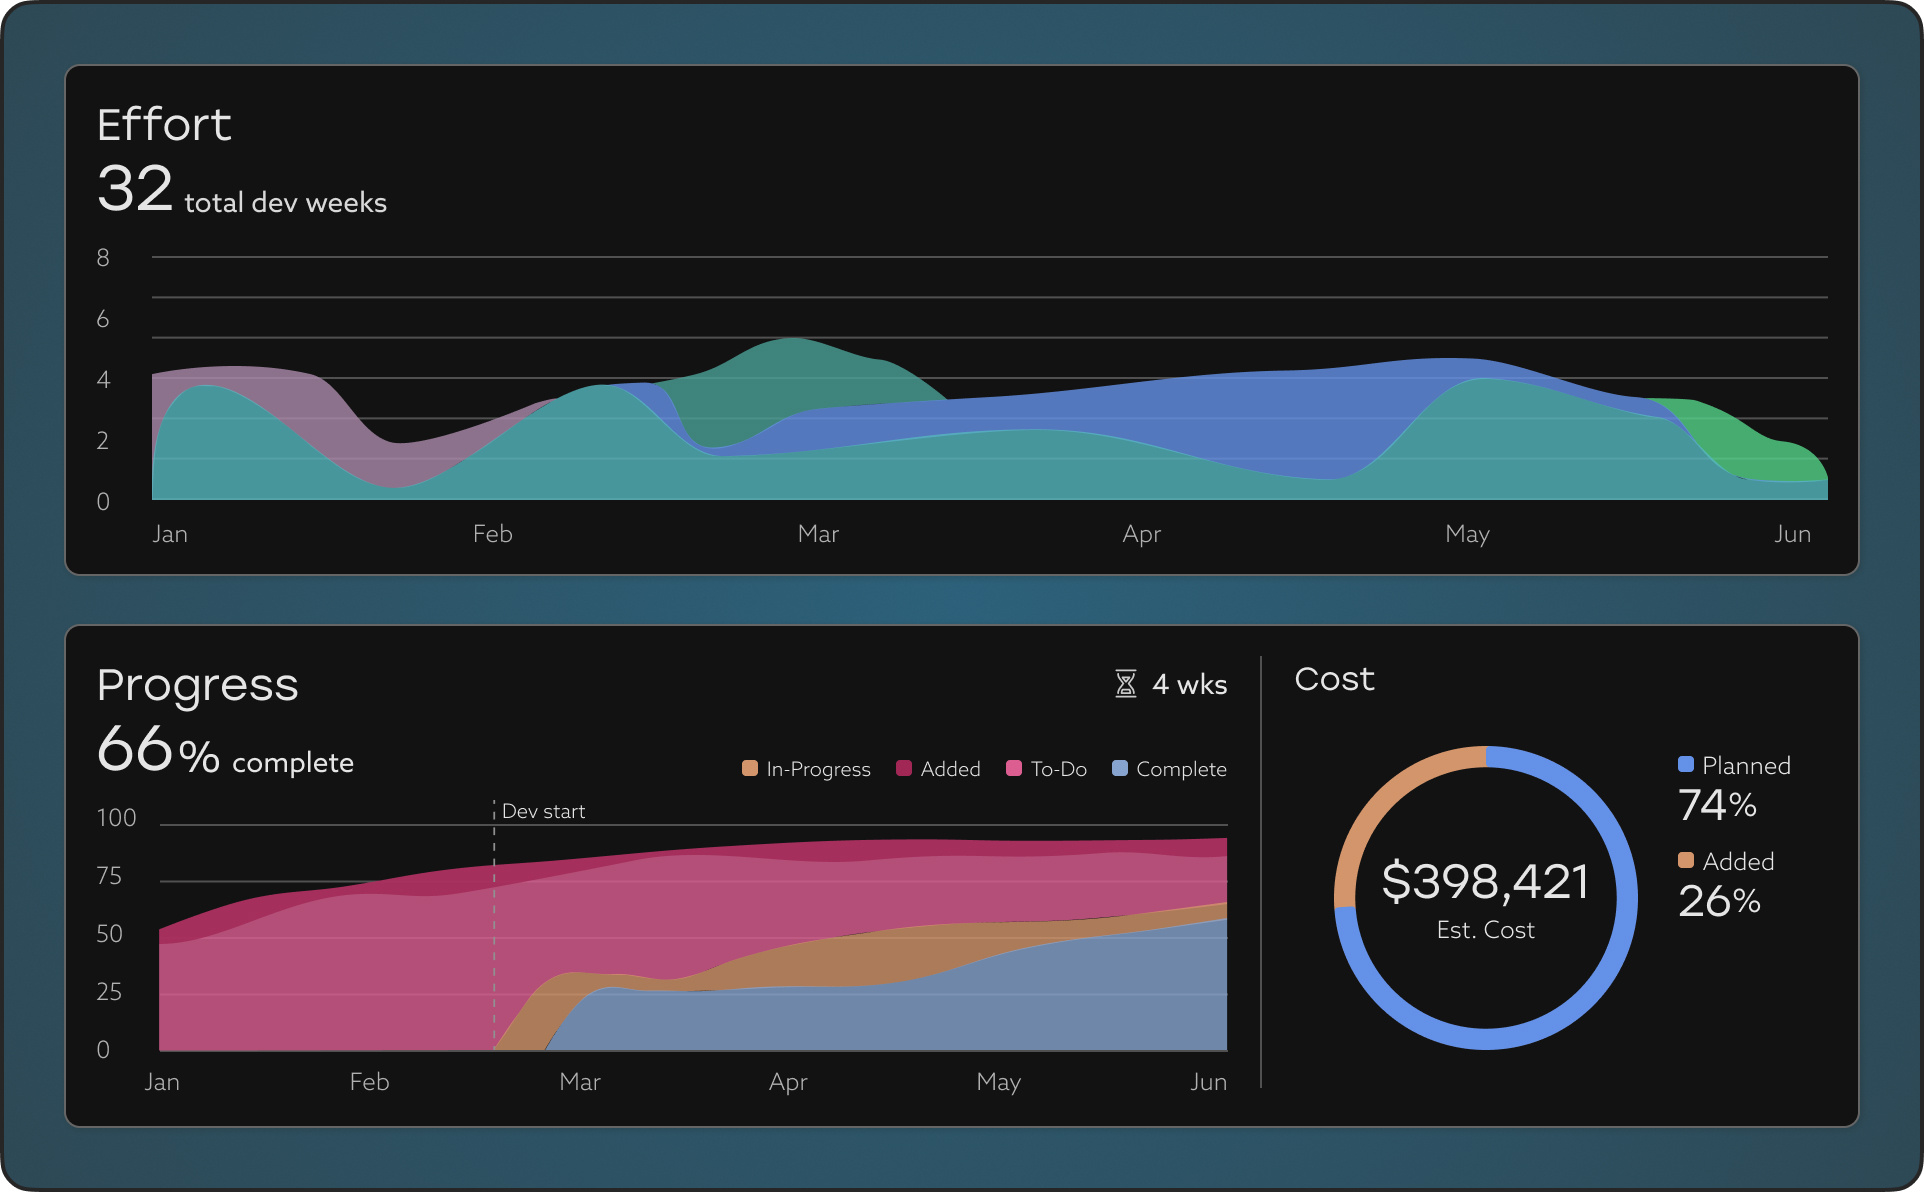
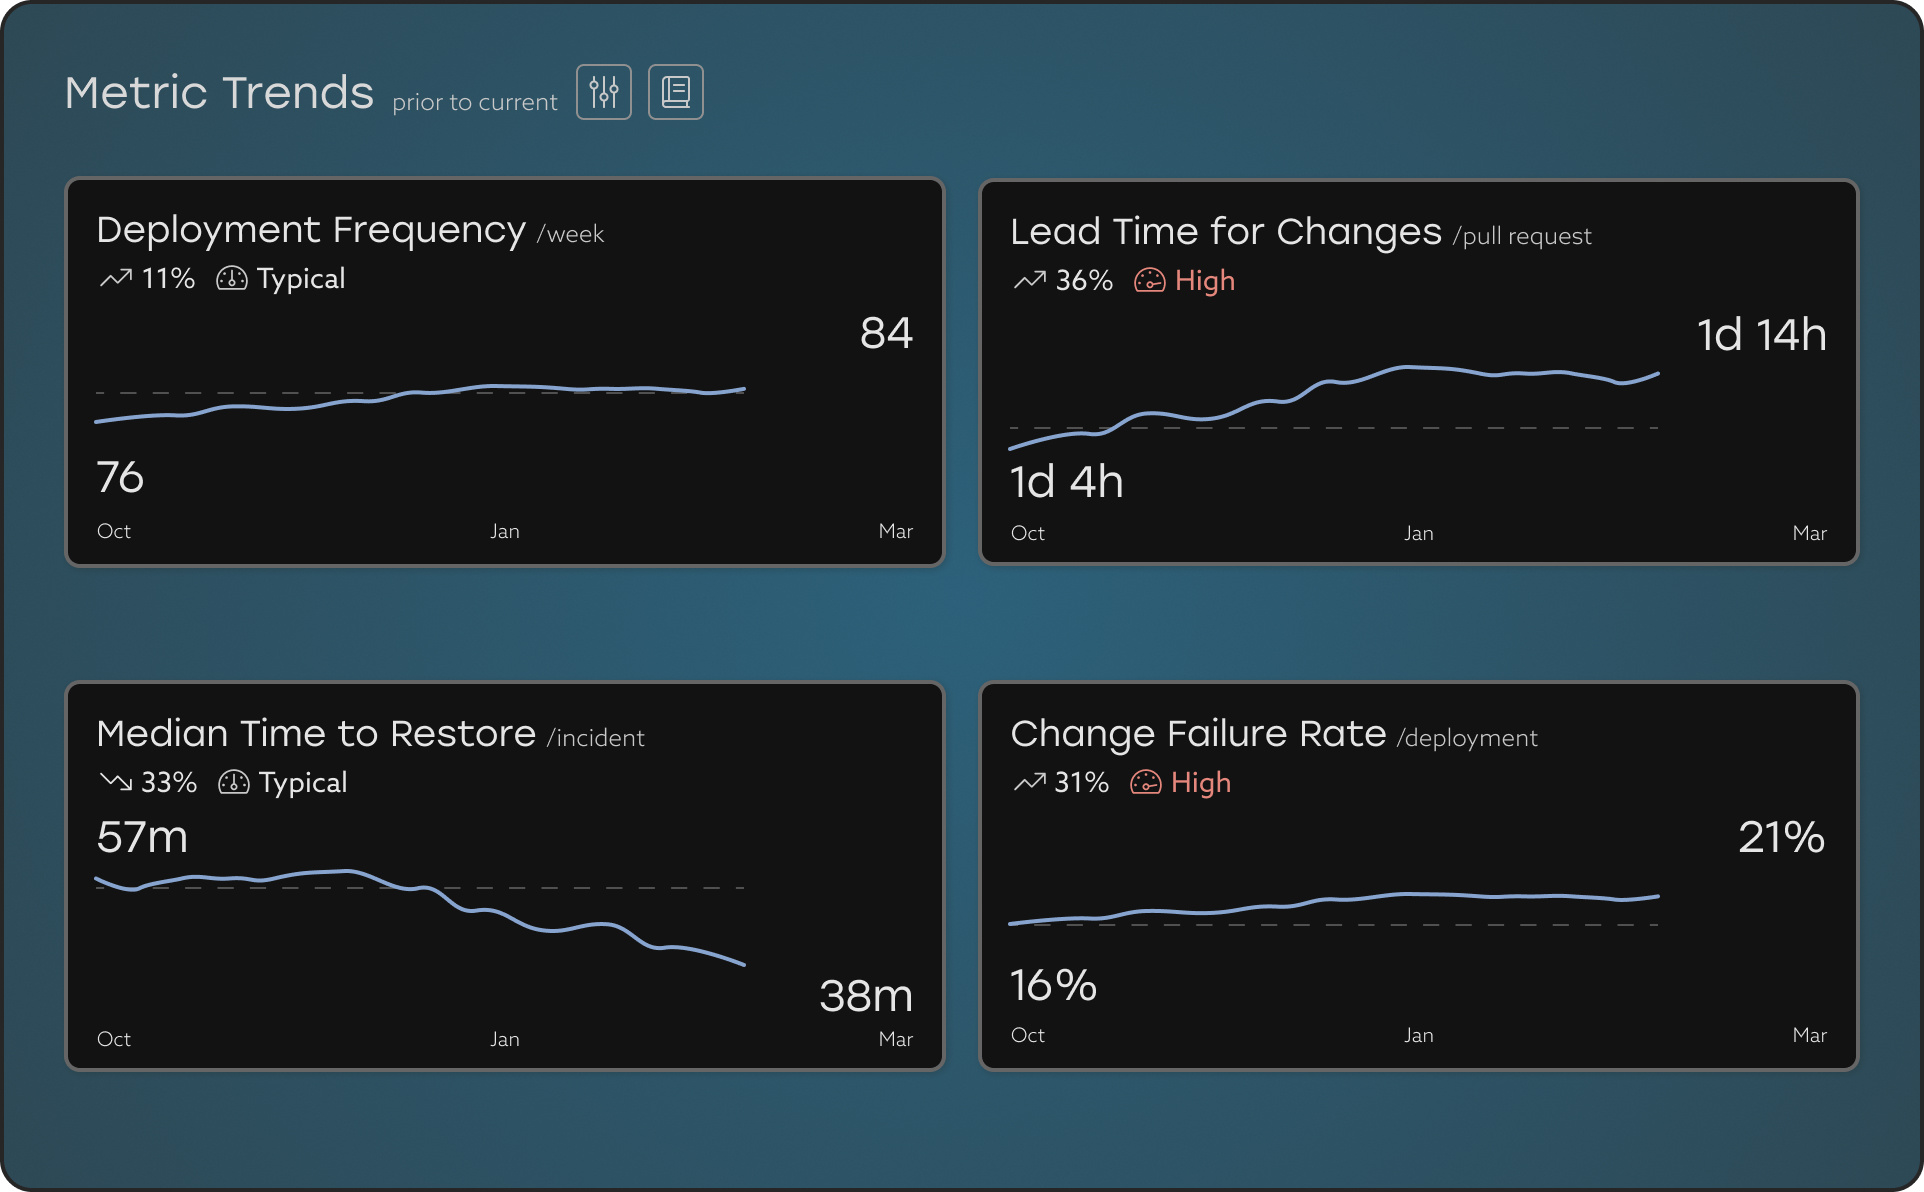
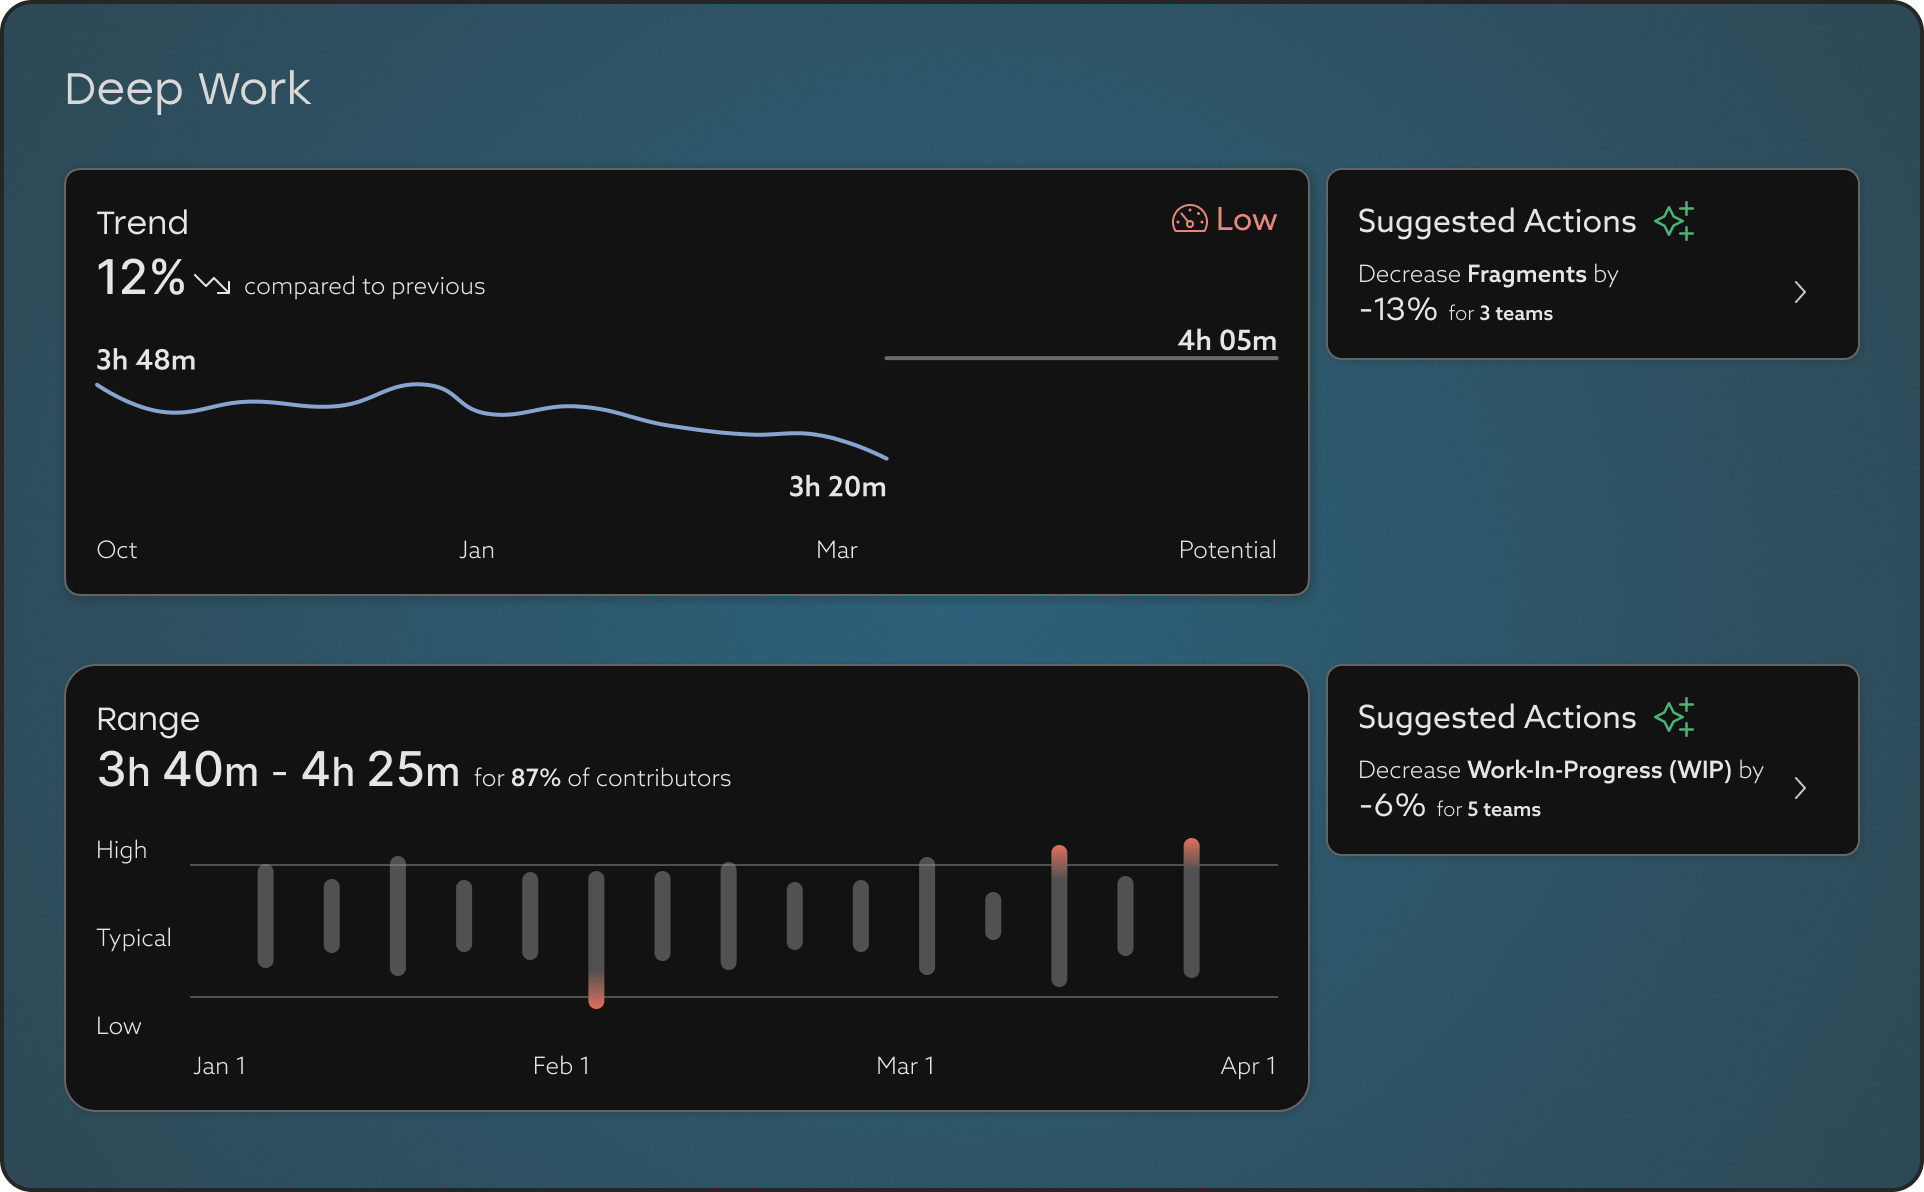
Uplevel reveals how your metrics fit together as part of a larger system — and then turns them into actionable, data-backed recommendations so you can move the needle.


Powerful configurations for the way you work
Set Uplevel to your unique deployment configuration, org structure, allocation schemes and rules, and user permissions.

Enterprise-grade Connector Hub
Sanitize your data on prem and share only what you approve — Uplevel has no access to your tooling's source data.

Hands-on customer success
Ongoing partnership with a dedicated CS manager, with regular check-ins as needed and an open line of communication.

Secure and compliant
We comply with leading security regulations like SOC 2 Type 2. Uplevel is built to protect your data and help you maintain compliance.
Ready to look under the hood?
Learn how Uplevel uses data from engineering tools to surface metrics, insights, and recommendations.