
Engineering teams are adopting AI tools at record pace, but the results on delivery metrics are mixed. A 2025 randomized controlled trial found that AI tools actually made experienced developers 19% slower, despite developers believing they were 20% faster. Meanwhile, the 2024 DORA report showed that every 25% increase in AI adoption correlated with a 1.5% decrease in delivery speed.
The problem isn't the tools themselves. It's that traditional approaches to measuring developer productivity focus on tracking what happened rather than enabling what should happen next.
Most engineering organizations treat productivity measurement like a data collection exercise. They implement DORA metrics, survey developers about satisfaction, and create dashboards showing cycle times and deployment frequency. When the numbers don't improve, they add more metrics, hoping additional data will reveal the secret to better performance.
The Limitations of Current Productivity Frameworks
There are several frameworks being used to measure engineering productivity today, plus a lot of metrics that don’t fall into either framework.
DORA Metrics: Necessary But Not Sufficient
DORA metrics remain valuable for understanding operational health. Deployment frequency, lead time for changes, change failure rate, and mean time to restore provide essential insights into your development pipeline's stability and speed.

However, DORA metrics have diminishing returns. Once you achieve good performance levels, optimizing these metrics further won't necessarily improve your engineering organization's effectiveness. More importantly, DORA metrics are lagging indicators—they tell you what happened after problems have already impacted your delivery.
Consider this scenario: Your DORA metrics show excellent performance—high deployment frequency, low change failure rates, fast recovery times. Yet your development team feels overwhelmed, your product managers complain about missed commitments, and your executive team questions whether engineering is working on the right priorities. DORA metrics alone can't explain this disconnect because they measure outputs, not the underlying system dynamics that create those outputs.
SPACE Framework: Comprehensive But Difficult to Implement
The SPACE framework, developed by some of the same researchers behind the DORA metrics, is meant to present a more encompassing view of your organization. It includes five different aspects of good engineering teams:
- Satisfaction and well-being
- Performance
- Activity
- Communication and collaboration
- Efficiency and flow
While SPACE recognizes the multidimensional nature of productivity, it provides little guidance on implementation. Engineering leaders often find SPACE "hand-wavy" because it doesn't specify what good performance looks like or how to prioritize improvements across its five dimensions.
DX Core 4: Prescriptive But Limited in Scope
The DX Core 4 framework, developed by the same researchers behind DORA and SPACE, attempts to solve the implementation challenge by providing specific metrics across four dimensions: Speed, Effectiveness, Quality, and Impact. Its primary strength lies in making bold choices about exactly what to measure, using "diffs per engineer" rather than lead time and introducing the Developer Experience Index (DXI) to quantify developer friction through standardized survey questions.
However, DX Core 4 has notable limitations. Its heavy reliance on self-reported metrics introduces potential bias, while the controversial "diffs per engineer" metric risks encouraging quantity over quality. Most importantly, DX Core 4 focuses primarily on measurement rather than providing systematic change enablement methodology.

The Missing Piece: Systems Thinking for Engineering Organizations
DORA, SPACE, and DX Core 4 each make valuable contributions, but they all treat engineering productivity primarily as a measurement problem rather than a systems optimization challenge. DORA focuses on operational metrics, SPACE provides theoretical breadth without practical guidance, and DX Core 4 offers prescriptive metrics but limited change methodology.
The WAVE Framework: A Systems Approach to Developer Productivity
Engineering effectiveness emerges from the interaction of four key dimensions:
- Ways of working
- Alignment to value
- Velocity
- Environmental efficiency
Uplevel's WAVE Framework provides a systematic approach to both measuring and improving engineering organizations. Unlike traditional frameworks that treat metrics as endpoints, WAVE treats measurement as the foundation for iterative improvement. Each "wave" of optimization reveals new opportunities for enhancement.
Where DORA provides operational metrics but limited scope, SPACE offers theoretical completeness without practical guidance, and DX Core 4 delivers prescriptive measurement without change methodology, WAVE combines sophisticated measurement with proven organizational change enablement via the Uplevel Method.
The framework addresses three critical gaps in existing approaches:
Beyond Measurement to Enablement: While other frameworks excel at data collection, WAVE pairs measurement with systematic change methodology, helping organizations turn insights into sustainable improvements.
Sociotechnical Integration: Rather than focusing primarily on technical metrics or treating developer experience as separate from productivity, WAVE recognizes that engineering effectiveness emerges from the interaction between technical systems and human factors.
Leading Indicator Focus: Where frameworks like DORA rely heavily on lagging indicators, WAVE emphasizes predictive metrics that help organizations prevent problems rather than just measure them after they occur.
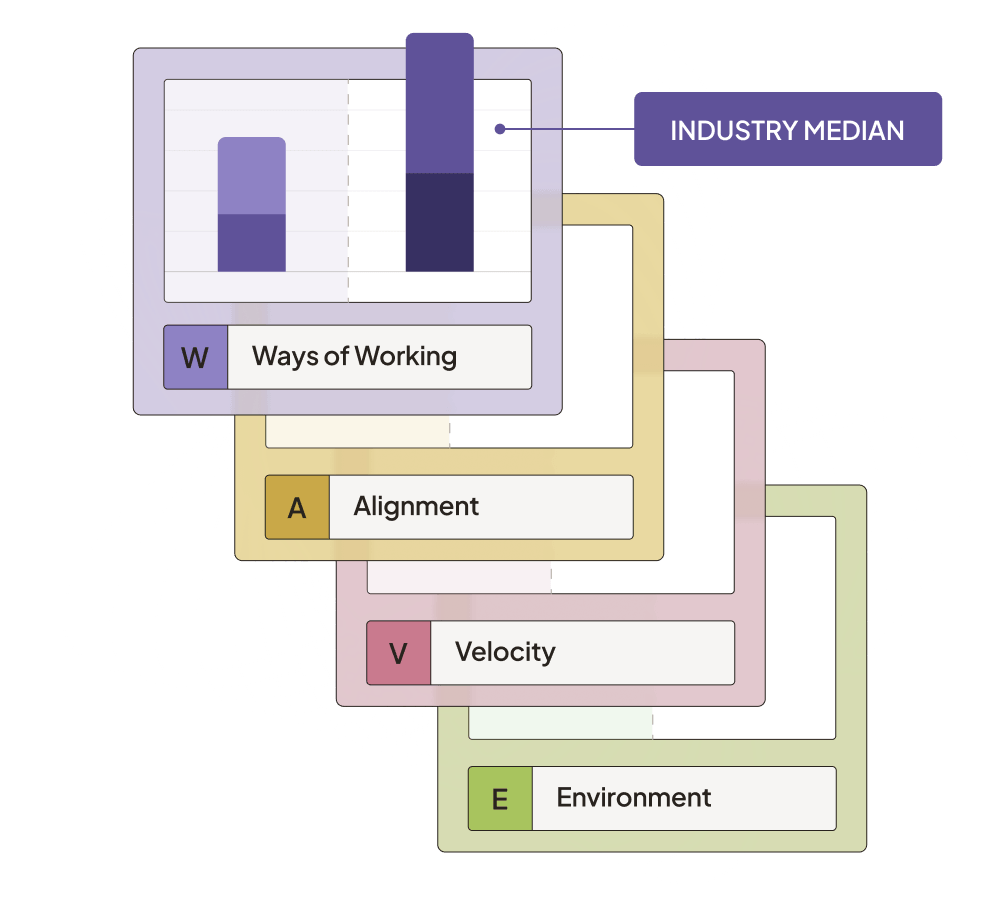
Tour the WAVE Framework
Four dimensions, 12 metrics, and the method that drives real engineering improvement
.png)
Ways of Working: the Cultural Foundation
Engineering performance starts with people and team dynamics, not just technical metrics. Ways of working measures three elements:
-
Deep work (uninterrupted coding time)
-
Team health (psychological safety and collaboration)
-
AI maturity (organizational process and readiness for AI tools)

Cultural factors create the foundation for all other performance improvements. Teams with strong psychological safety collaborate more effectively and take calculated risks that drive innovation. Protected focus time enables complex problem-solving, while clear AI guidelines prevent organizational confusion that diverts energy from value creation. When cultural elements align, technical improvements follow naturally.
Alignment: Business Value Connection
Alignment tracks the gaps between what teams build and what drives value and how engineering effort creates business outcomes through:
-
Allocation of effort (time spent on new features vs. maintenance)
-
Planning effectiveness (requirement stability and sprint completion)
-
User alignment (feedback cycle time after releases)

Strong alignment ensures engineering capacity translates into meaningful business impact. When teams understand priorities clearly and receive rapid user feedback, they make better decisions about what to build and when to pivot. Poor alignment wastes resources on low-impact work, regardless of how efficiently teams execute. The goal is connecting engineering excellence to business results.
Velocity: Work Flow Efficiency
Velocity measures work movement through:
-
Composite velocity score (various throughput metrics)
-
Handoffs (transition quality between teams)
-
PR reviews (complexity and review effectiveness)
Velocity directly impacts engineering performance by revealing where work gets stuck versus where it flows smoothly. Teams that optimize their entire delivery pipeline — not just individual coding speed — ship more value with less effort. When handoffs are clean and reviews are efficient, engineering capacity translates into business outcomes rather than getting lost in coordination overhead.

Environment Efficiency: System Support
Environmental efficiency evaluates how well systems support productive work through:
-
Recovery (DORA metrics)
-
Code quality (bugs and complexity)
-
Friction (architecture and tooling obstacles)

Environmental factors determine whether engineering talent operates at full capacity or fights systemic constraints. Poor technical foundations force teams to spend time on operational firefighting instead of feature development. Quality tooling and robust architecture multiply individual productivity, while technical debt and unreliable systems create drag that no amount of individual effort can overcome.
From Measurement to Movement
Implementing developer productivity measurement with a focus on improvement requires leaders to balance insight and action.
Start with Baseline Assessment
Begin by establishing baseline measurements across all four WAVE dimensions. You don't need to establish perfect measurement immediately — start by understanding your current state well enough to identify the highest-leverage improvement opportunities.
The Uplevel Method collects data from your development tools, interviews with leaders, and targeted developer surveys to understand both the quantitative patterns and qualitative developer experience.
Focus on One Dimension at a Time
Optimizing all four dimensions simultaneously leads to initiative overload and minimal progress. Instead, identify your biggest constraint and focus improvement efforts there first.
For example, a growing SaaS company discovered their primary constraint was in ways of working: their developers were context switching between too many concurrent projects, making deep work nearly impossible. They implemented WIP limits and batched similar tasks together, which helped improve morale and deep work time (and kickstarted improvements in velocity). But only after improving their ways of working did they tackle velocity improvements in their deployment pipeline.
Enable Change, Don't Just Measure It
The most critical difference between WAVE and other frameworks is the emphasis on enablement alongside measurement. Collecting better data without the organizational capability to act on insights creates frustration rather than improvement.
This means pairing measurement initiatives with change management support for engineering managers, clear communication about why changes matter, and the authority to actually implement improvements. Successful engineering optimization requires both better data and better change practices.
Turn engineering metrics into meaningful change with the Uplevel Method
The Uplevel Method gives you the capabilities and tools you need to start getting better and keep getting better.

Making Developer Productivity Software Work for Your Organization
When evaluating how to measure productivity in software development with engineering intelligence platforms, prioritize solutions that combine measurement with change enablement. Look for platforms that explain not just what's happening, but why — and that help you figure out what to do next.
Essential capabilities include:
-
Holistic measurement across technical and cultural dimensions
-
Leading indicators that predict problems before they impact delivery
-
Context-rich insights that explain the "why" behind metrics
-
Change methodology that turns insights into improvements
The highest-performing engineering organizations treat productivity measurement as organizational learning. They use data to identify systemic constraints and implement changes that compound over time. The specific framework matters less than the principle: measurement should enable change, not just document current state.